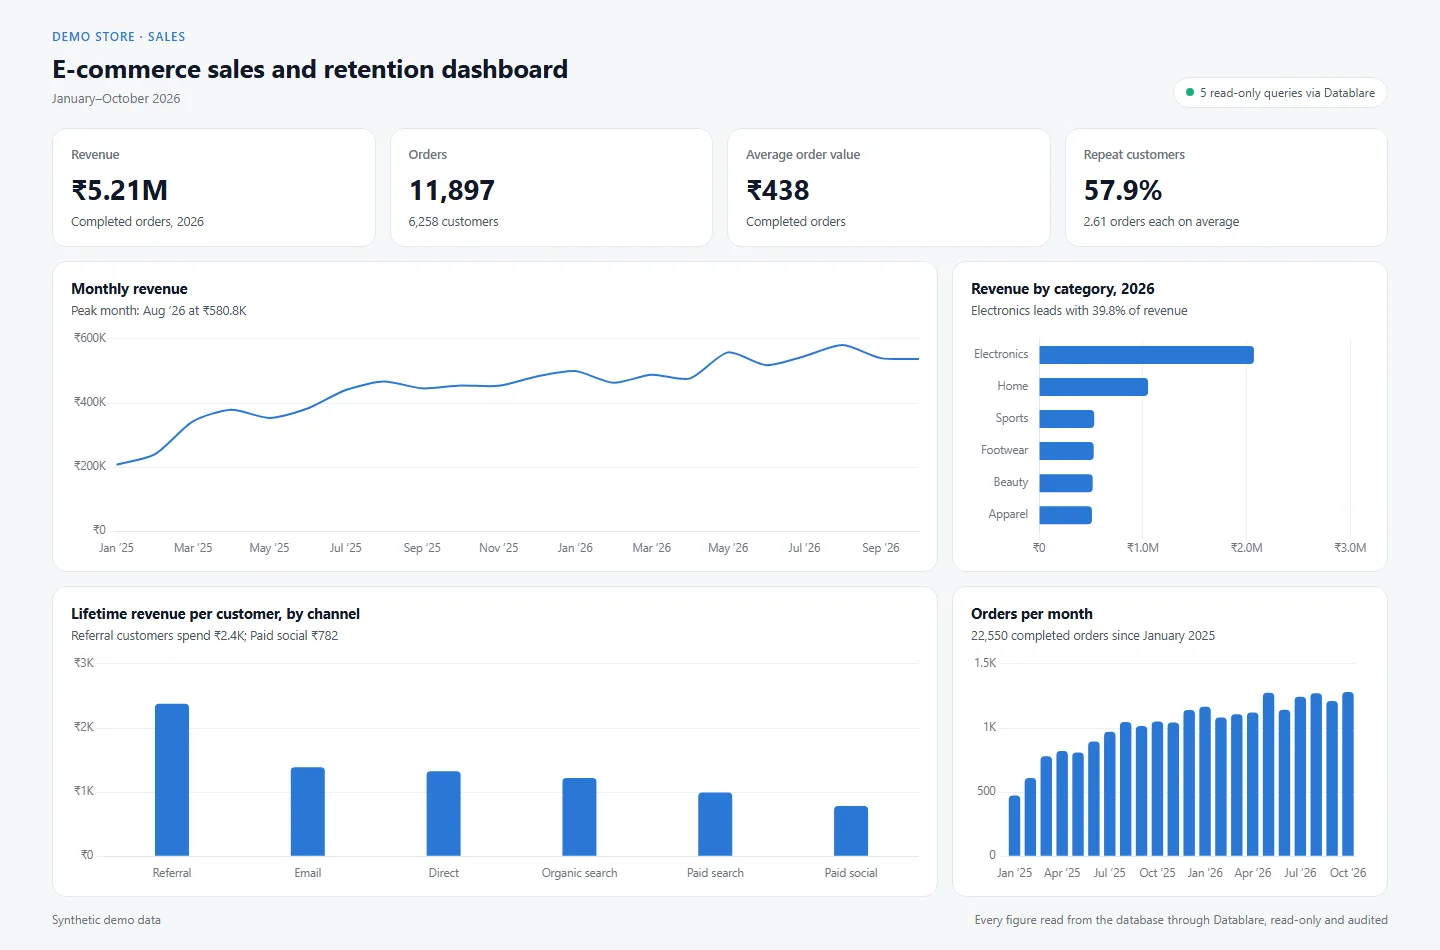
Built from 5 read-only queries. Every figure on the dashboard was read from the database through Datablare; nothing was estimated or typed in.
Headline numbers (January–October 2026):
- Revenue: ₹5.21M (Completed orders, 2026)
- Orders: 11,897 (6,258 customers)
- Average order value: ₹438 (Completed orders)
- Repeat customers: 57.9% (2.61 orders each on average)
What stands out:
- Monthly revenue: Peak month: Aug ’26 at ₹580.8K
- Revenue by category, 2026: Electronics leads with 39.8% of revenue
- Lifetime revenue per customer, by channel: Referral customers spend ₹2.4K; Paid social ₹782
- Orders per month: 22,550 completed orders since January 2025
The data is a synthetic e-commerce dataset made for this example, so the numbers describe no real company. The queries, the dashboard and the audit entries are real: Claude reached the database only through Datablare, read-only, and every query is on record with the question it served.