Skip to content
Datablare

Use cases

Dashboards AI agents build from your database

Give Claude a short brief and it builds the dashboard, querying your database through Datablare: read-only, only the tables you allow, every query on record. Each one below was built that way, on a demo dataset for its industry. Open one to see the brief, the SQL it ran and the audit entry it left.

24 dashboards · 8 industries · 97 read-only queries · 20 tables · 0 rows changed

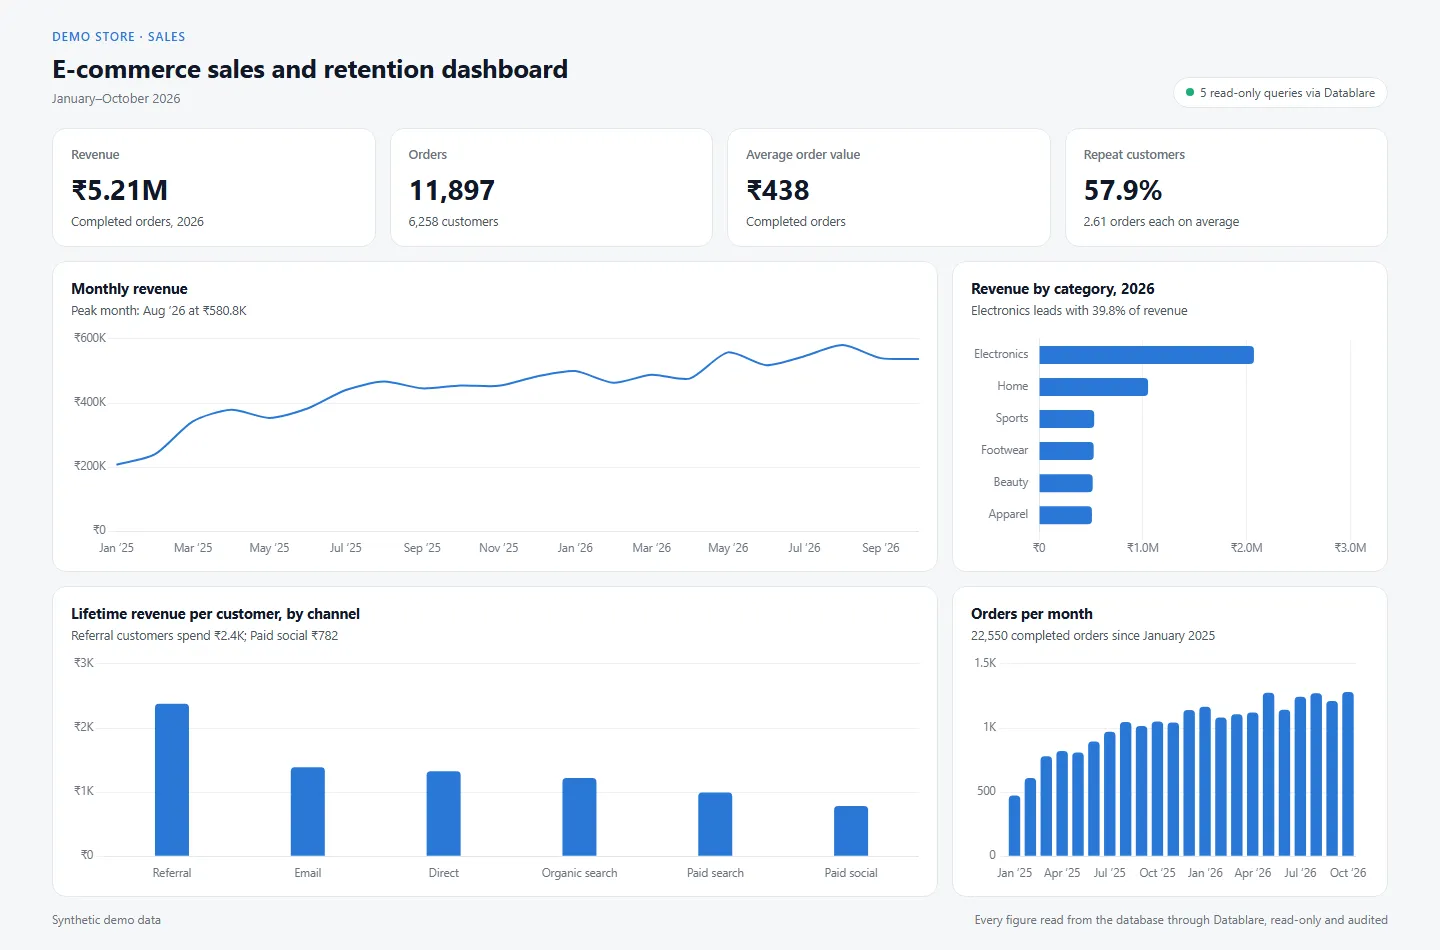
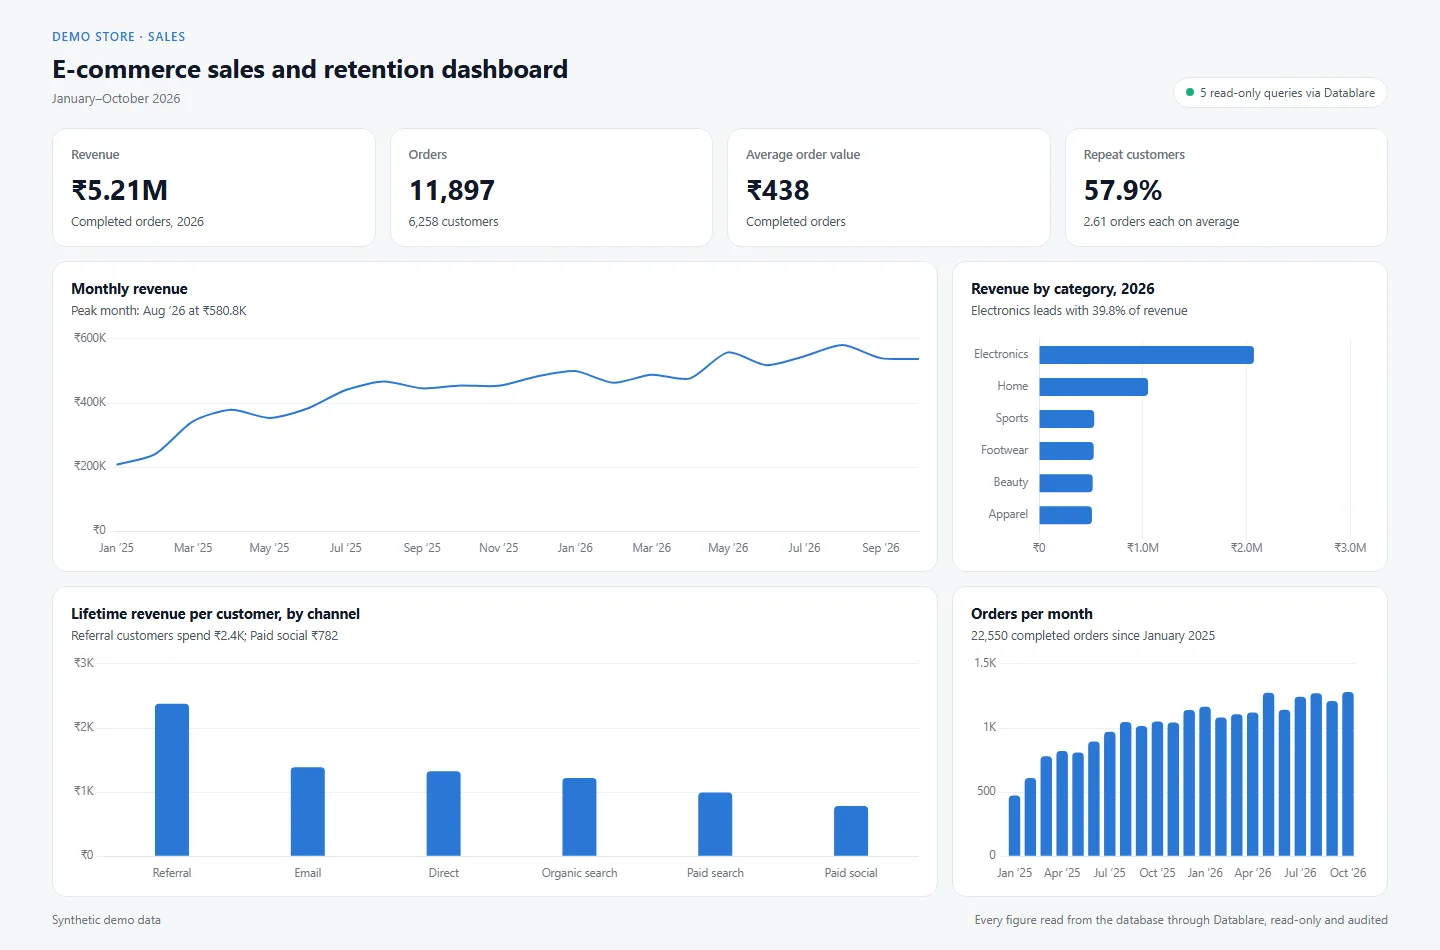
E-commerce sales and retention dashboard dashboard: Monthly revenue, Revenue by category, 2026, Lifetime revenue per customer, by channel, Orders per month
E-commerce Executive overview

E-commerce sales and retention dashboard

₹5.21M revenue from 11,897 orders this year, a 57.9% repeat-customer rate, and which channels bring the customers who spend most.

The brief

Build me a sales dashboard for the store: revenue, orders and average order value this year, the monthly revenue trend, revenue by category, which acquisition channel brings the customers who spend the most, and how many customers come back to buy again.
See the SQL and the audit entry
All use cases

24 of 24 use cases

  • E-commerce sales and retention dashboard dashboard: Monthly revenue, Revenue by category, 2026, Lifetime revenue per customer, by channel, Orders per month
    Claude Code E-commerce Executive overview

    E-commerce sales and retention dashboard

    ₹5.21M revenue from 11,897 orders this year, a 57.9% repeat-customer rate, and which channels bring the customers who spend most.

    Updated Open

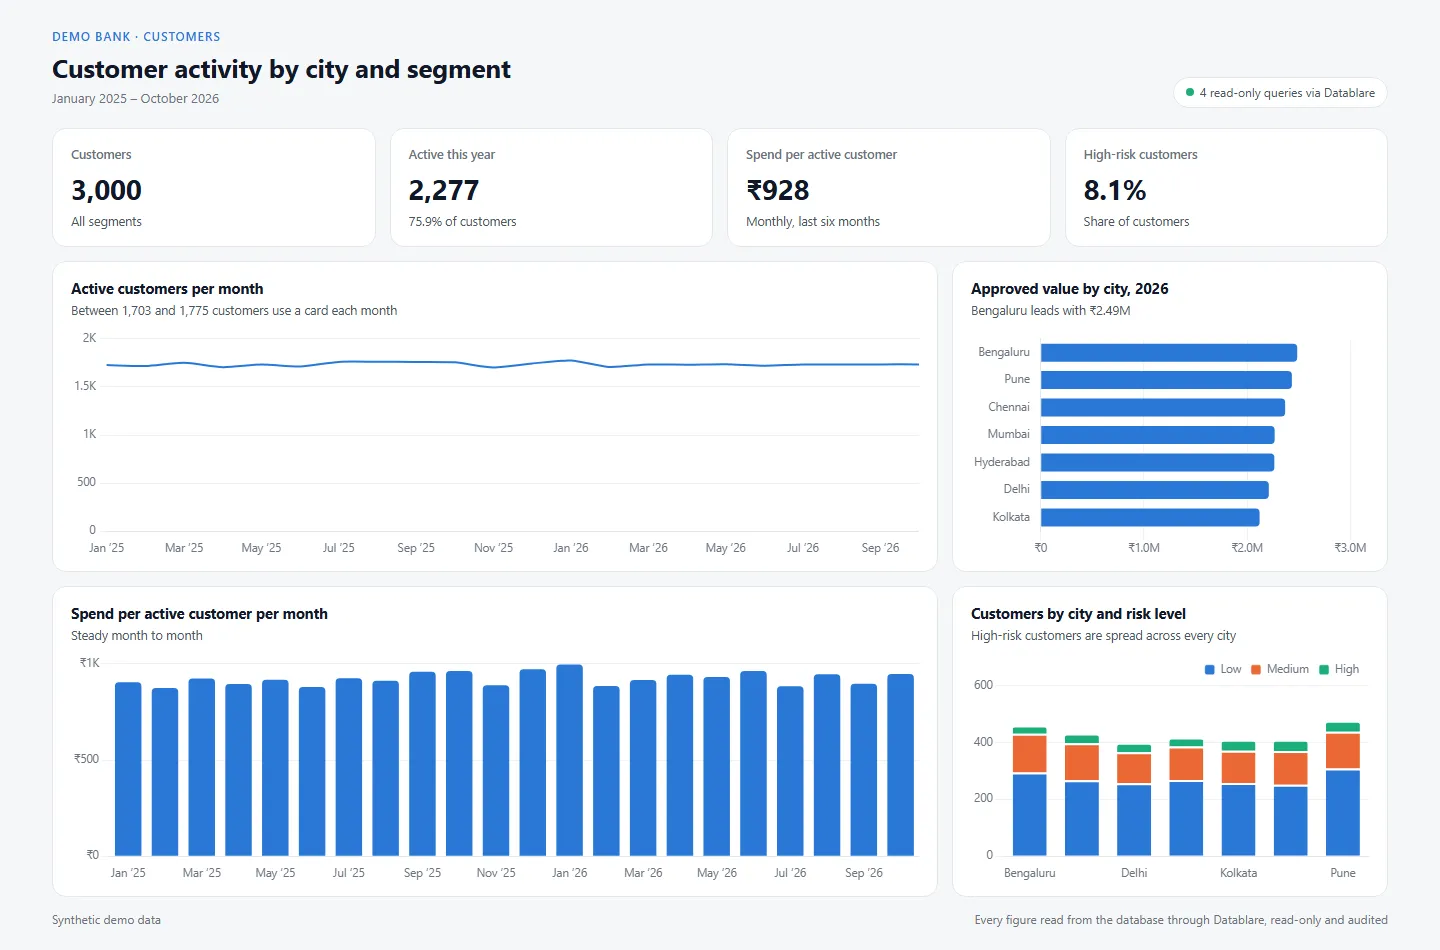
  • Customer activity by city and segment dashboard: Active customers per month, Approved value by city, 2026, Spend per active customer per month, Customers by city and risk level
    Claude Code Banking Customer analytics

    Customer activity by city and segment

    2,277 of 3,000 customers active this year, spend per active customer each month, value by city, and the risk mix in each city.

    Updated Open

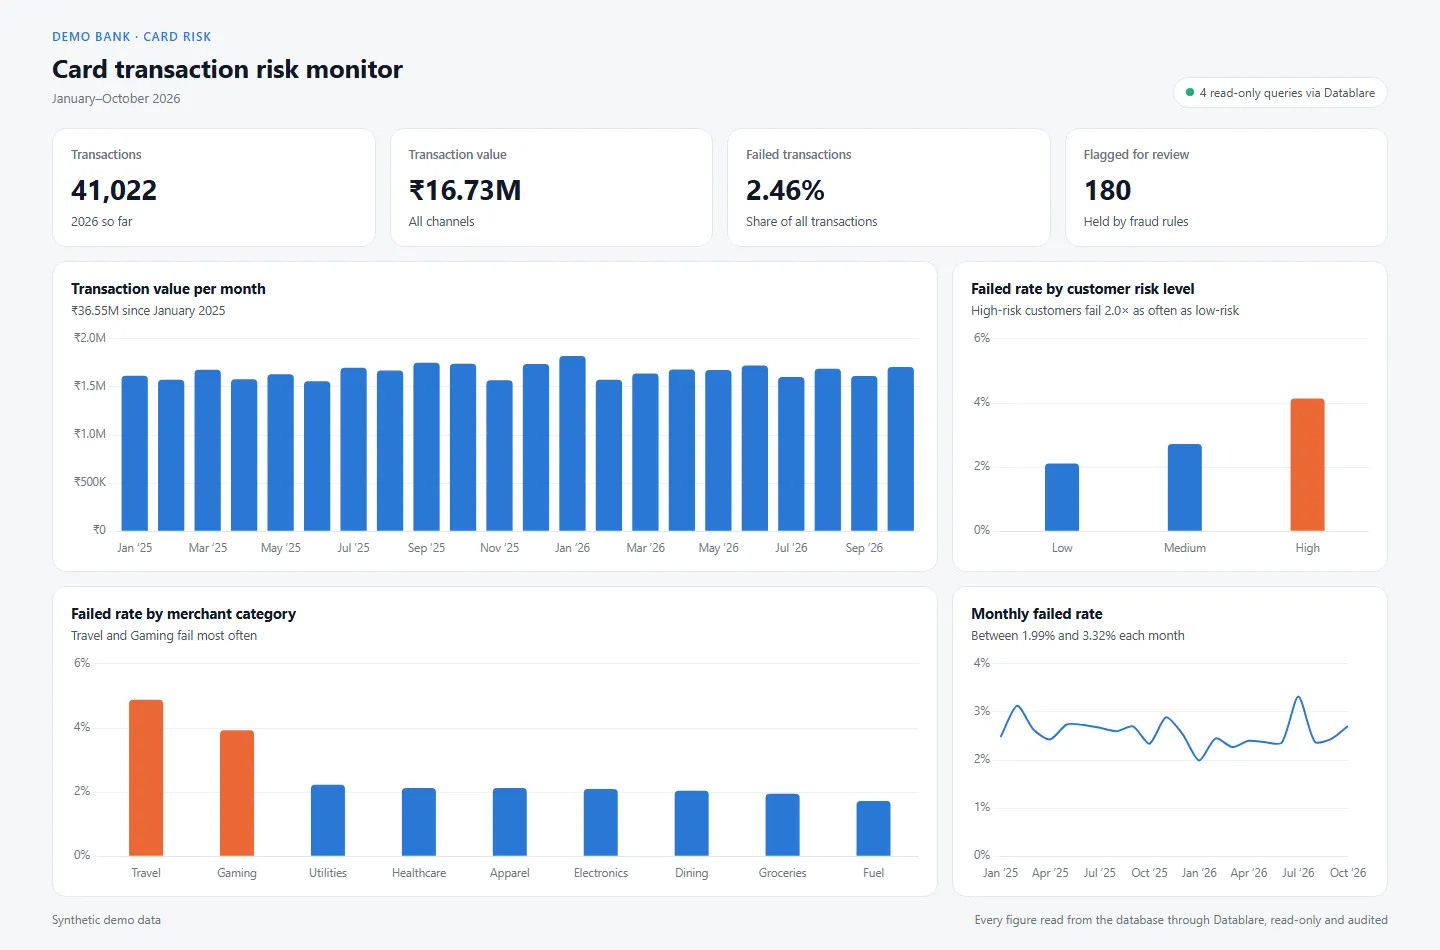
  • Card transaction risk monitor dashboard: Transaction value per month, Failed rate by customer risk level, Failed rate by merchant category, Monthly failed rate
    Claude Code Banking Risk & compliance

    Card transaction risk monitor

    41,022 card transactions worth ₹16.73M, a 2.46% failure rate, and where failures concentrate by risk level and merchant.

    Updated Open

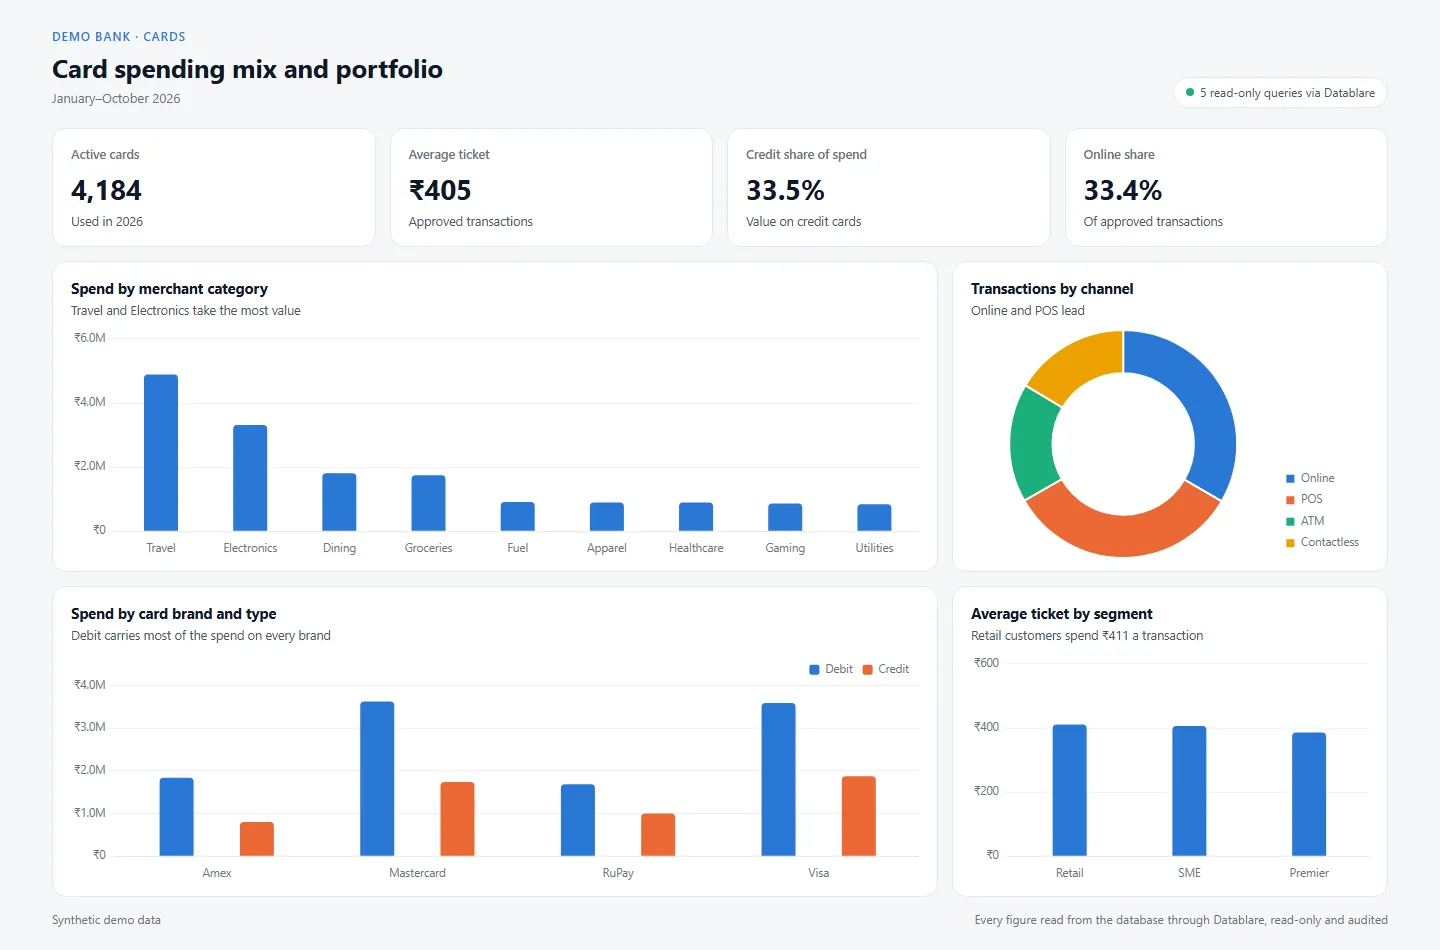
  • Card spending mix and portfolio dashboard: Spend by merchant category, Transactions by channel, Spend by card brand and type, Average ticket by segment
    Claude Code Banking Revenue & growth

    Card spending mix and portfolio

    4,184 active cards with a ₹405 average ticket; Travel leads spend and 33% of transactions are online.

    Updated Open

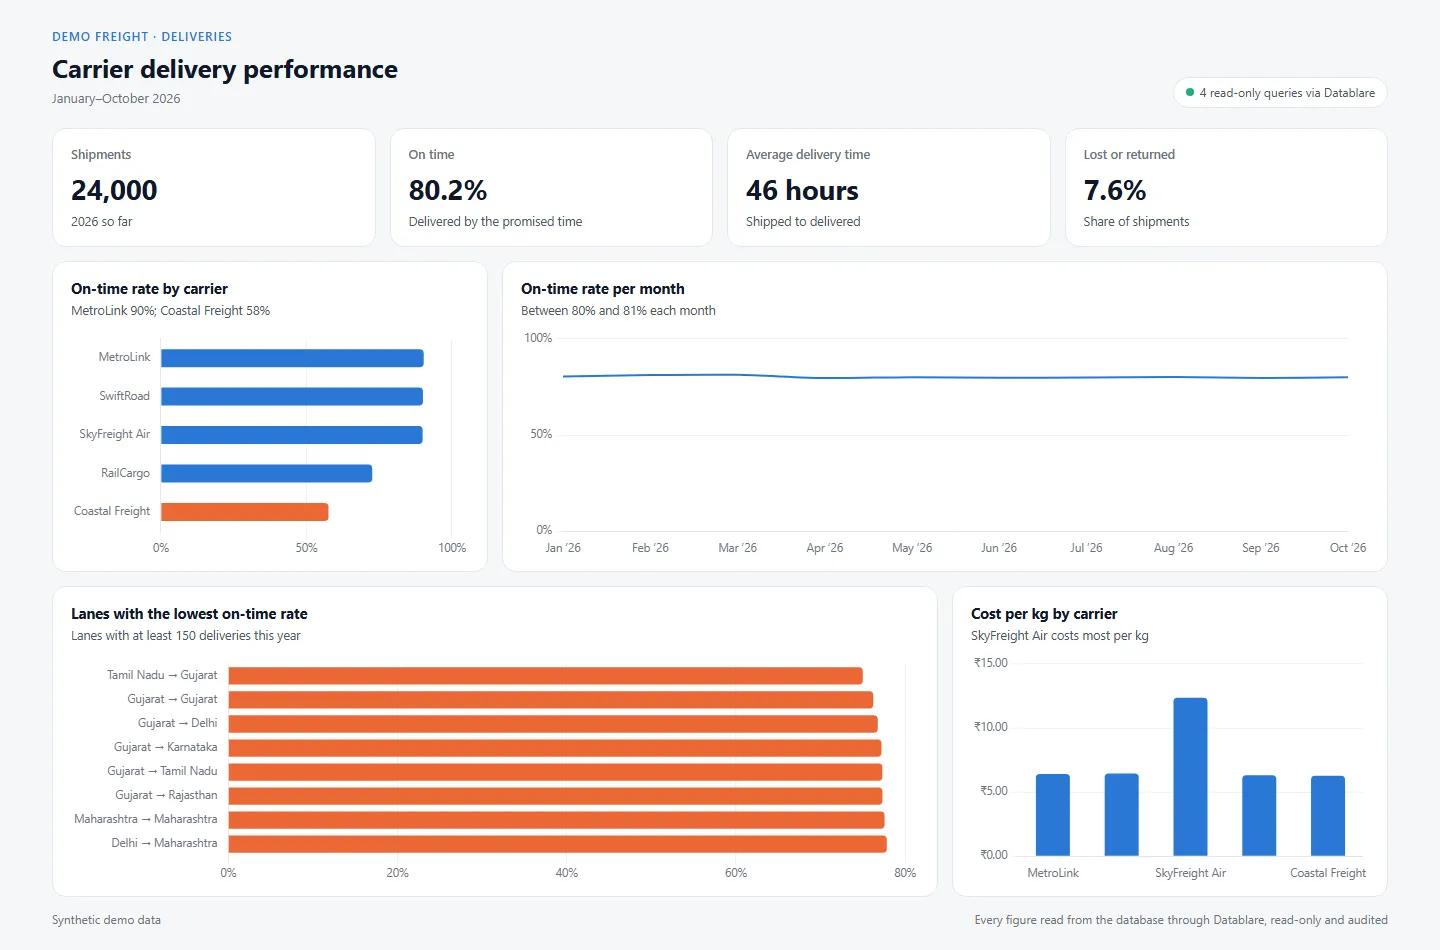
  • Carrier delivery performance dashboard: On-time rate by carrier, On-time rate per month, Lanes with the lowest on-time rate, Cost per kg by carrier
    Claude Code Logistics Operations

    Carrier delivery performance

    24,000 shipments, 80.2% on time and 46 hours from pickup to delivery on average, with on-time rate and cost by carrier and lane.

    Updated Open

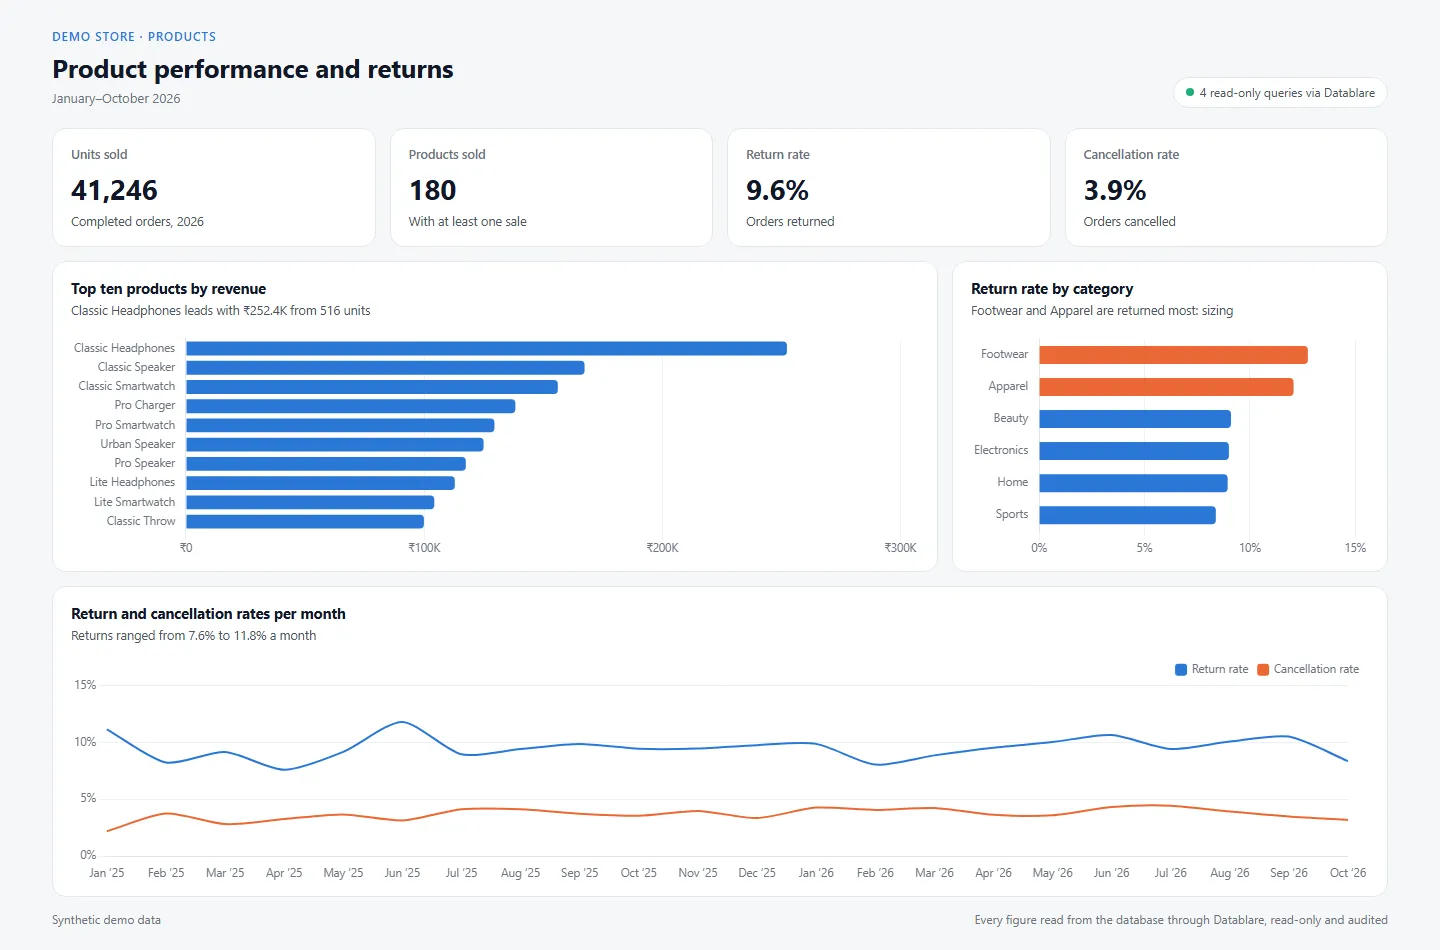
  • Product performance and returns dashboard: Top ten products by revenue, Return rate by category, Return and cancellation rates per month
    Claude Code E-commerce Product & marketing

    Product performance and returns

    41,246 units sold this year with a 9.6% return rate; Footwear and Apparel are returned most, and Classic Headphones leads revenue.

    Updated Open

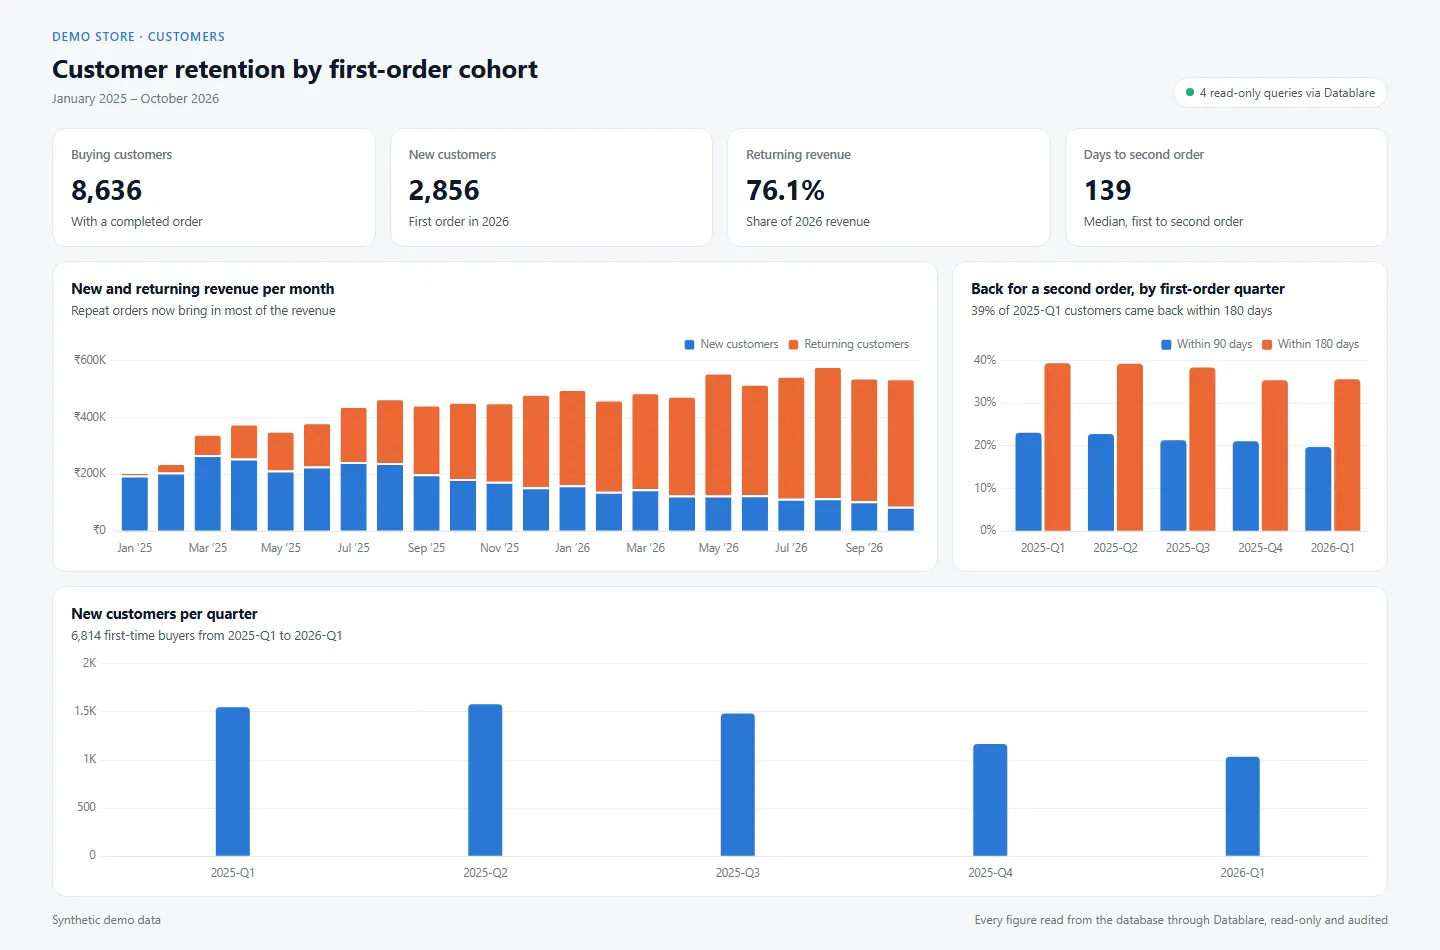
  • Customer retention by first-order cohort dashboard: New and returning revenue per month, Back for a second order, by first-order quarter, New customers per quarter
    Claude Code E-commerce Customer analytics

    Customer retention by first-order cohort

    2,856 new customers this year, 76.1% of revenue from returning customers, and a median 139 days to a second order.

    Updated Open

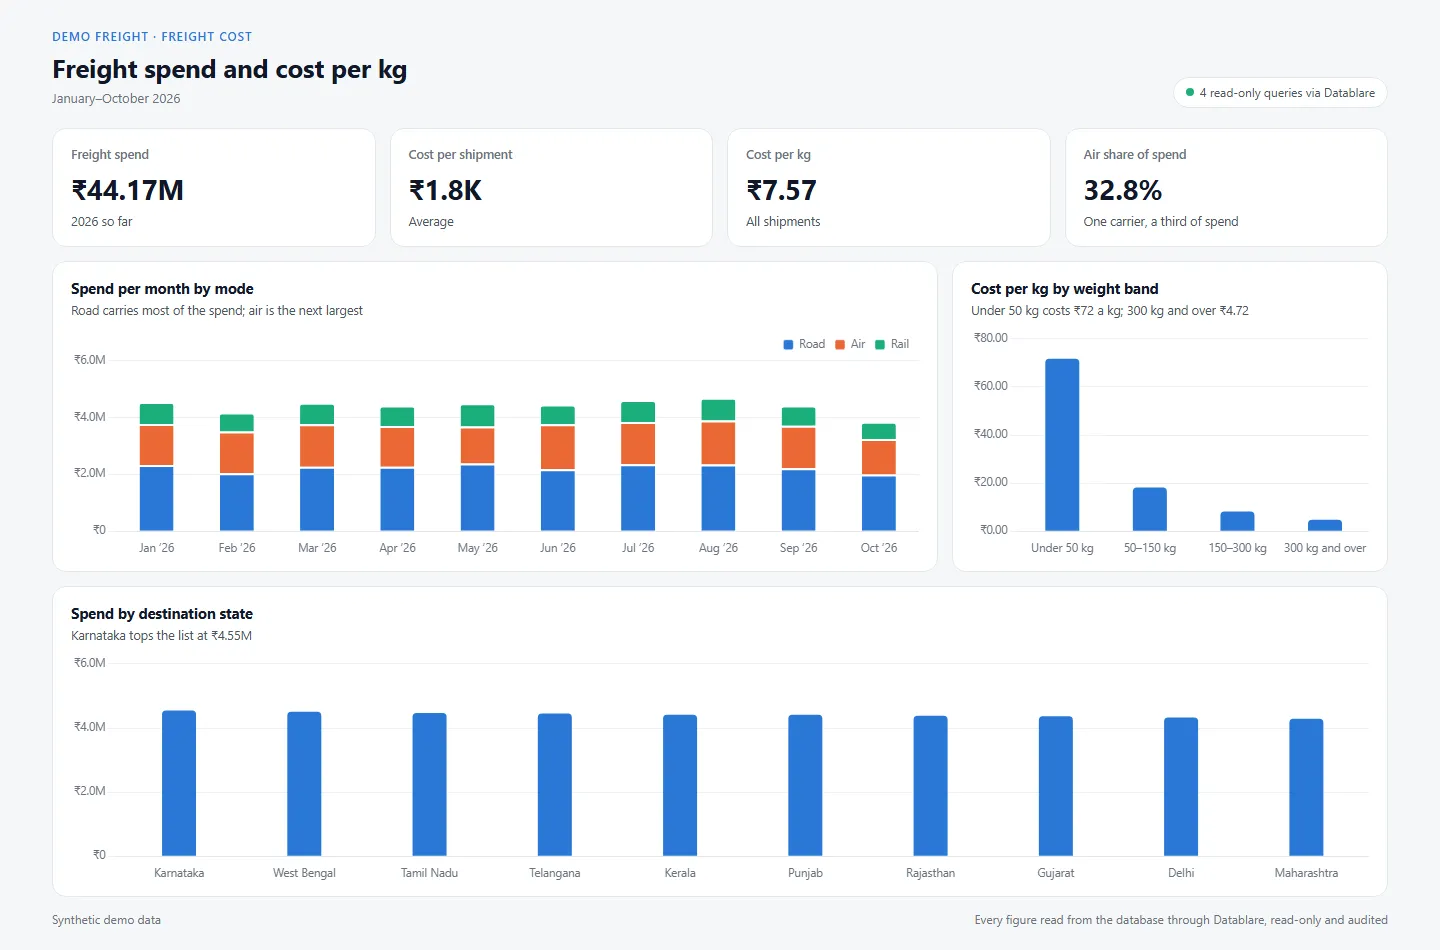
  • Freight spend and cost per kg dashboard: Spend per month by mode, Cost per kg by weight band, Spend by destination state
    Claude Code Logistics Cost & spend

    Freight spend and cost per kg

    ₹44.17M of freight this year at ₹1.8K a shipment; air is 33% of spend, and small parcels cost the most per kg.

    Updated Open

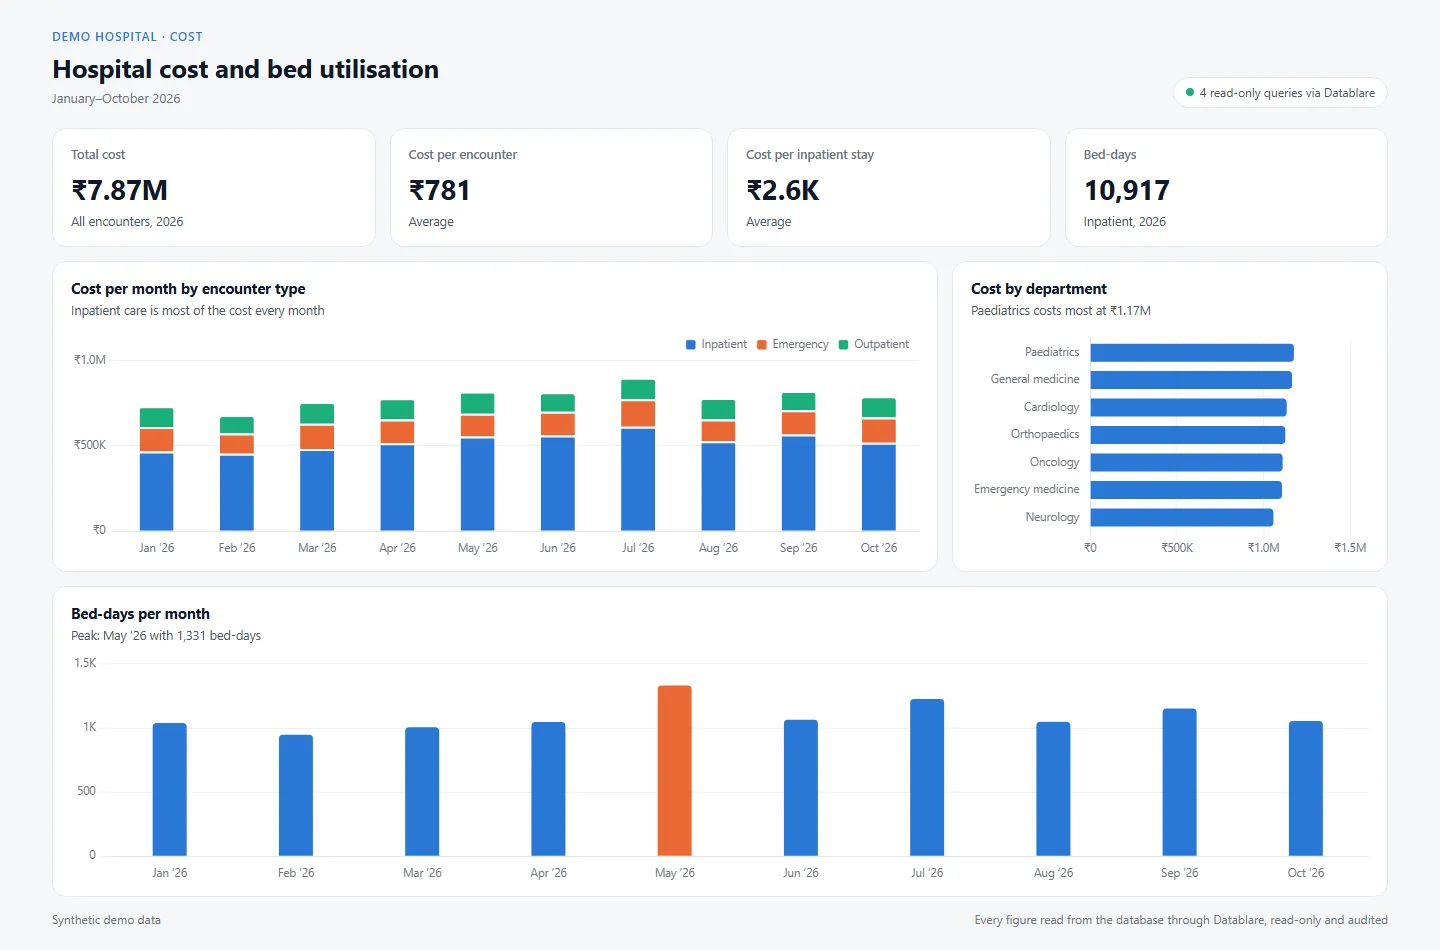
  • Hospital cost and bed utilisation dashboard: Cost per month by encounter type, Cost by department, Bed-days per month
    Claude Code Healthcare Cost & spend

    Hospital cost and bed utilisation

    ₹7.87M spent this year, ₹2.6K per inpatient stay and 10,917 bed-days, by department and month.

    Updated Open

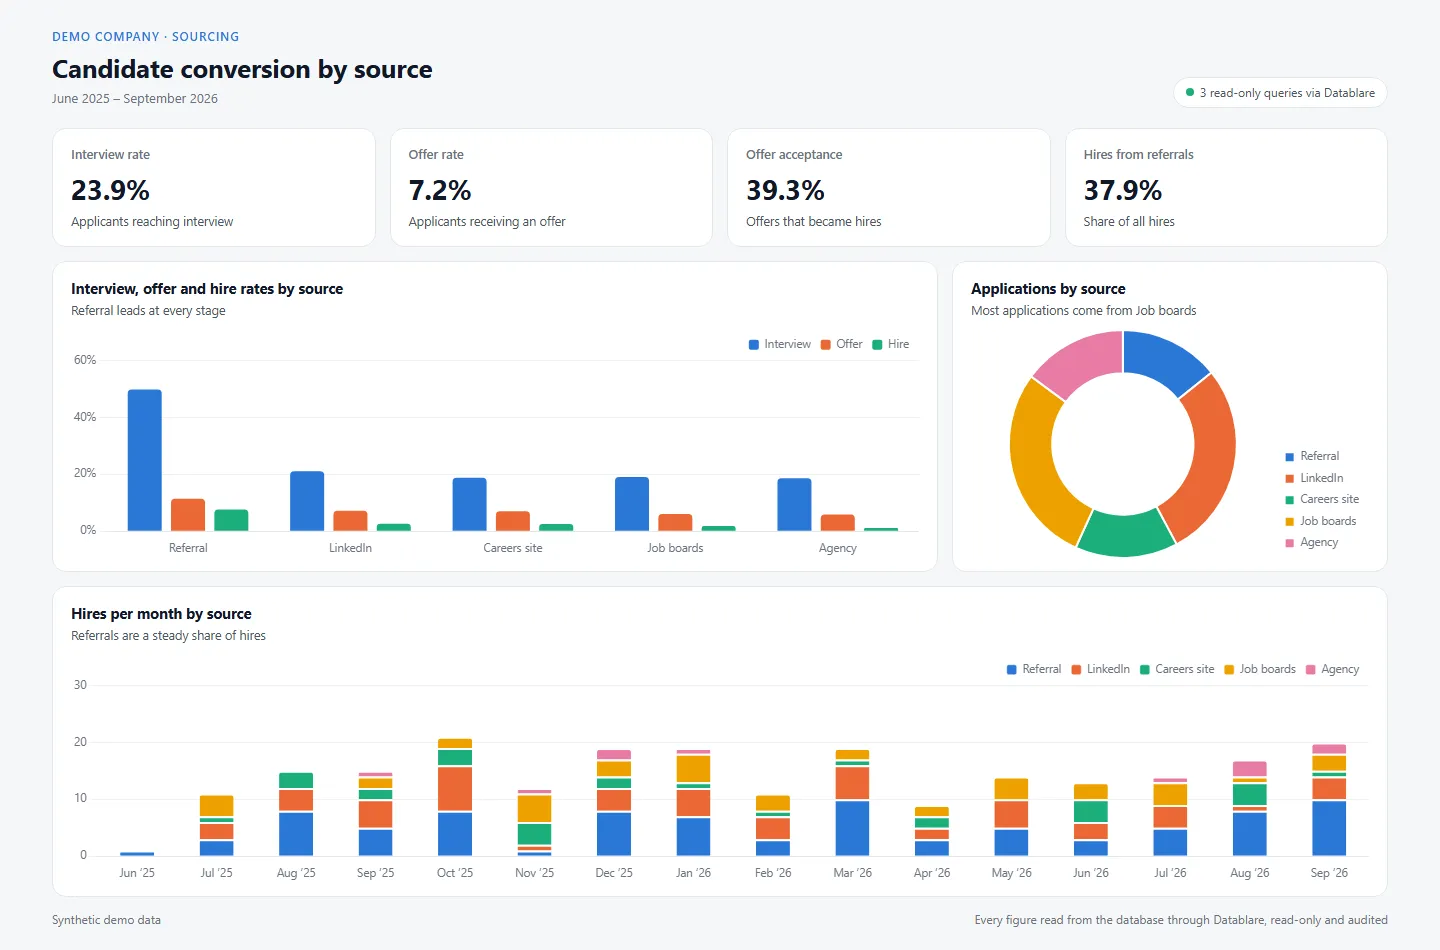
  • Candidate conversion by source dashboard: Interview, offer and hire rates by source, Applications by source, Hires per month by source
    Claude Code Human resources People & hiring

    Candidate conversion by source

    Referrals bring 38% of hires and convert at 7.6%, against 1.1% for the weakest source, Agency; 39% of offers are accepted.

    Updated Open

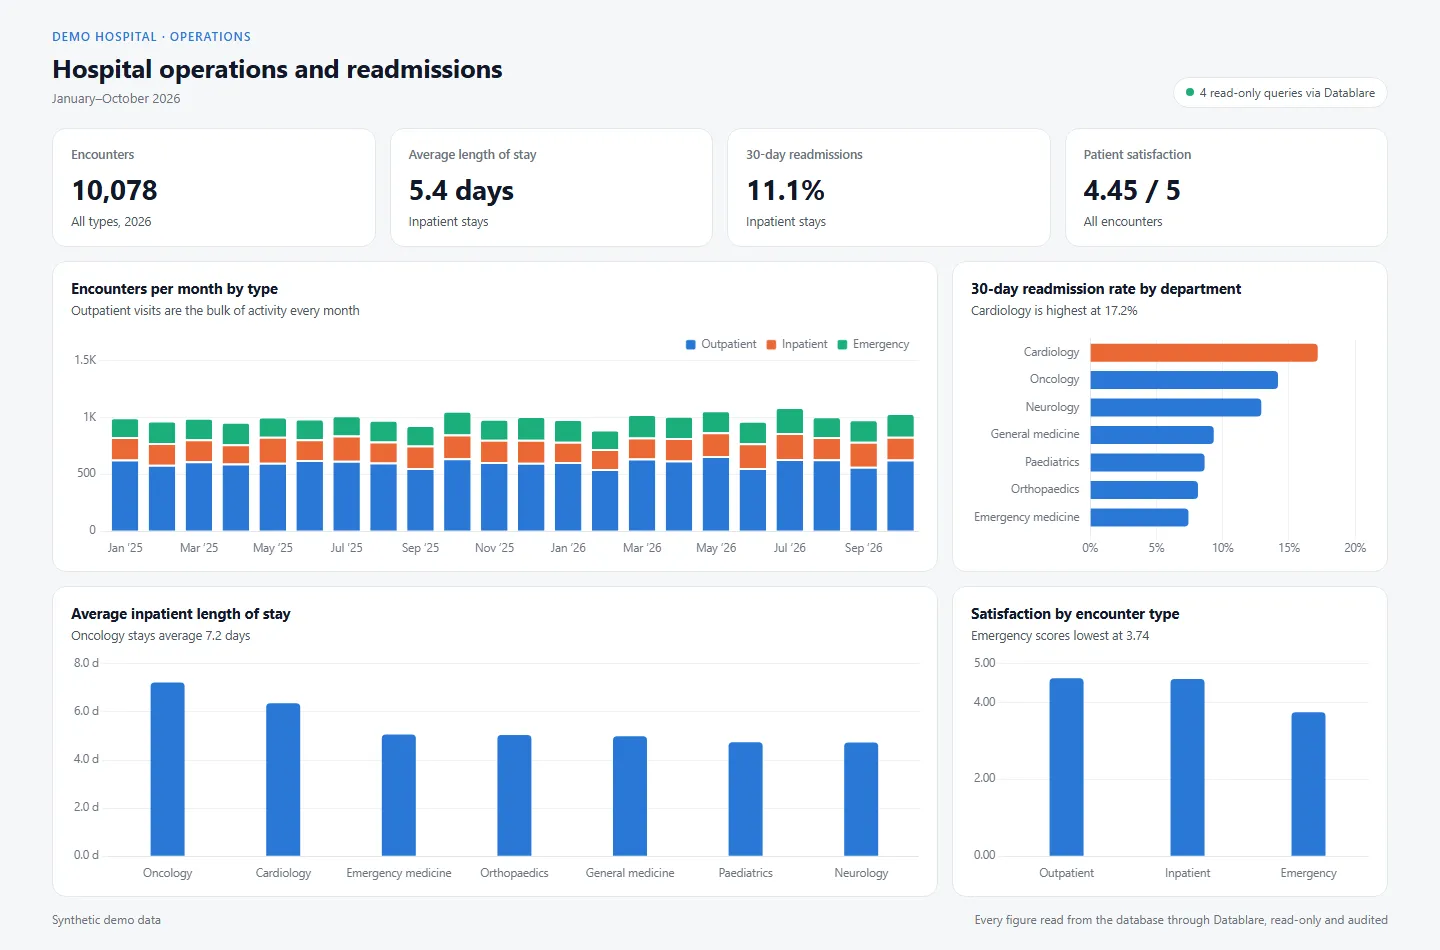
  • Hospital operations and readmissions dashboard: Encounters per month by type, 30-day readmission rate by department, Average inpatient length of stay, Satisfaction by encounter type
    Claude Code Healthcare Operations

    Hospital operations and readmissions

    10,078 encounters this year, a 30-day readmission rate of 11.1% and an average stay of 5.4 days, broken down by department.

    Updated Open

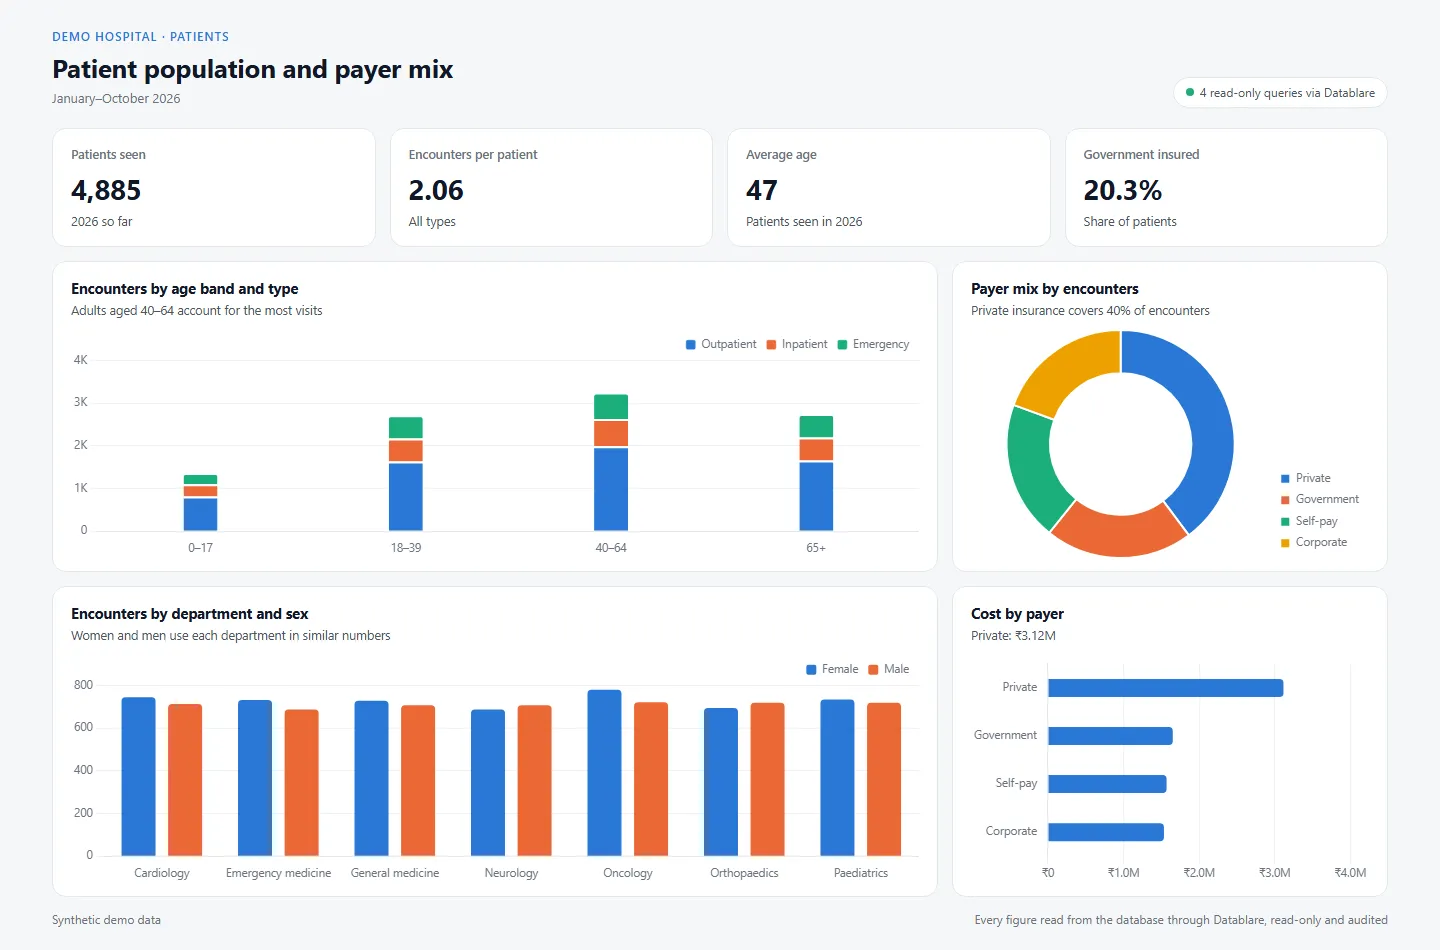
  • Patient population and payer mix dashboard: Encounters by age band and type, Payer mix by encounters, Encounters by department and sex, Cost by payer
    Claude Code Healthcare Customer analytics

    Patient population and payer mix

    4,885 patients seen this year, average age 46.6, 2.06 encounters each, and a payer mix led by private insurance.

    Updated Open

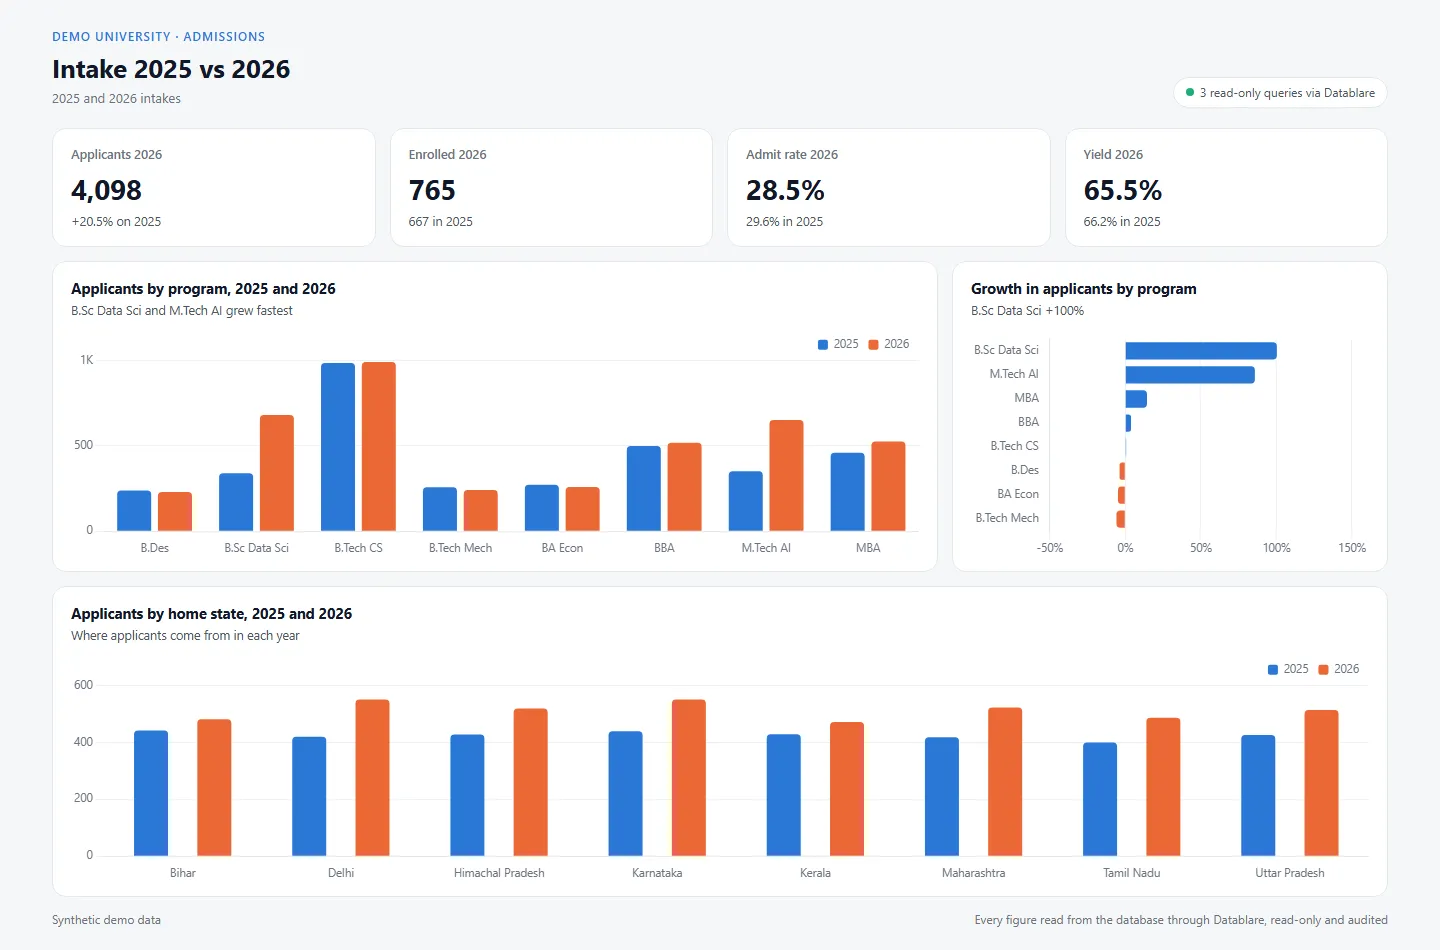
  • Intake 2025 vs 2026 dashboard: Applicants by program, 2025 and 2026, Growth in applicants by program, Applicants by home state, 2025 and 2026
    Claude Code Education Executive overview

    Intake 2025 vs 2026

    Applicants up 20% to 4,098 and enrollments up to 765, led by B.Sc Data Sci (+100%).

    Updated Open

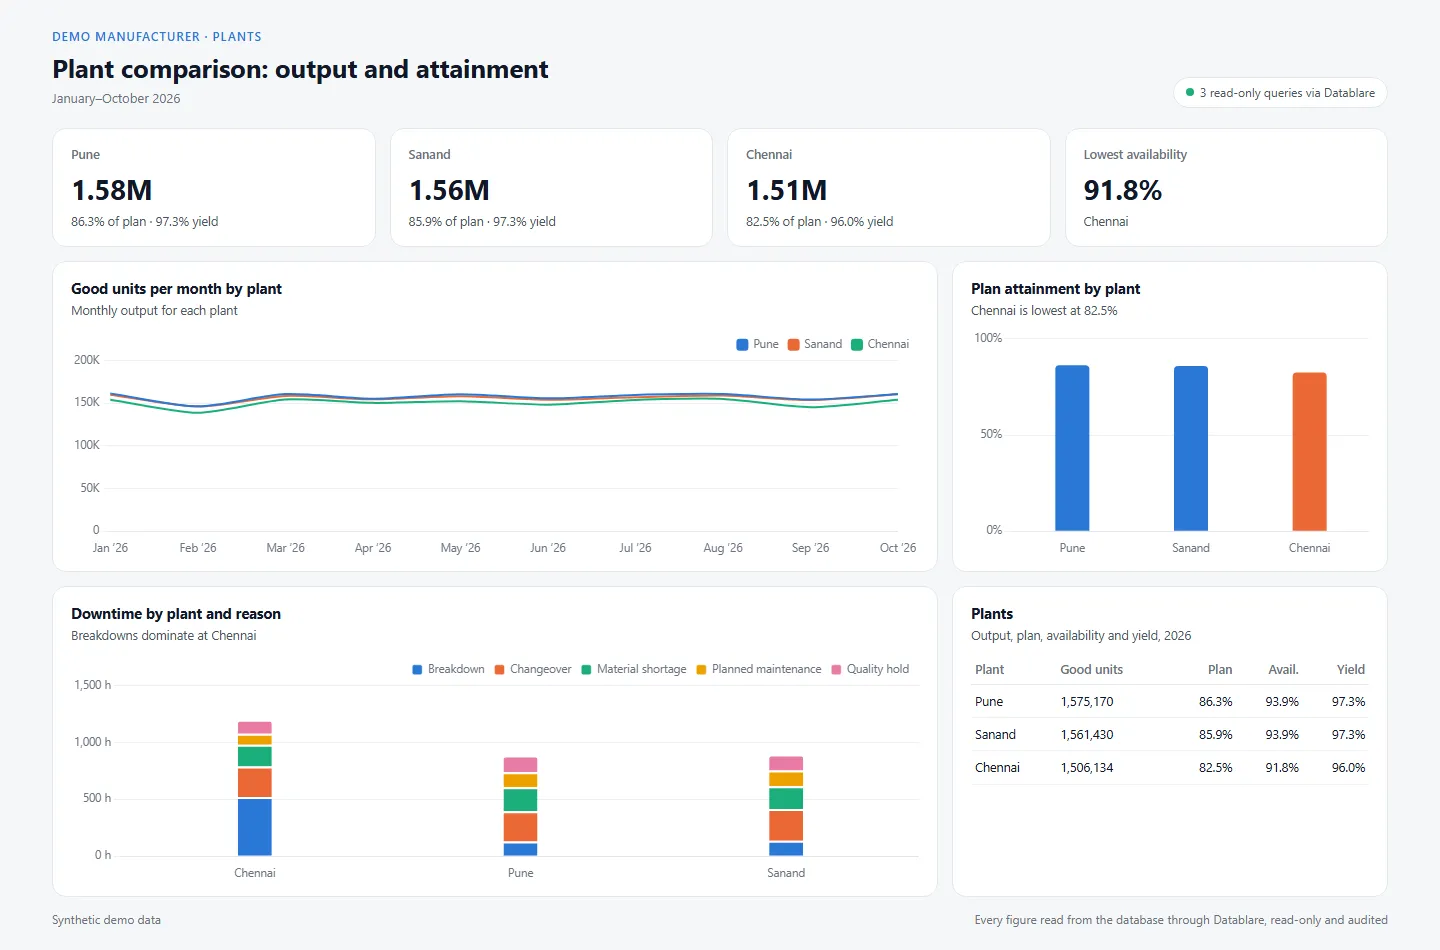
  • Plant comparison: output and attainment dashboard: Good units per month by plant, Plan attainment by plant, Downtime by plant and reason, Plants
    Claude Code Manufacturing Executive overview

    Plant comparison: output and attainment

    Pune leads output with 1,575,170 good units; Chennai trails at 82.5% of plan, held back by breakdowns.

    Updated Open

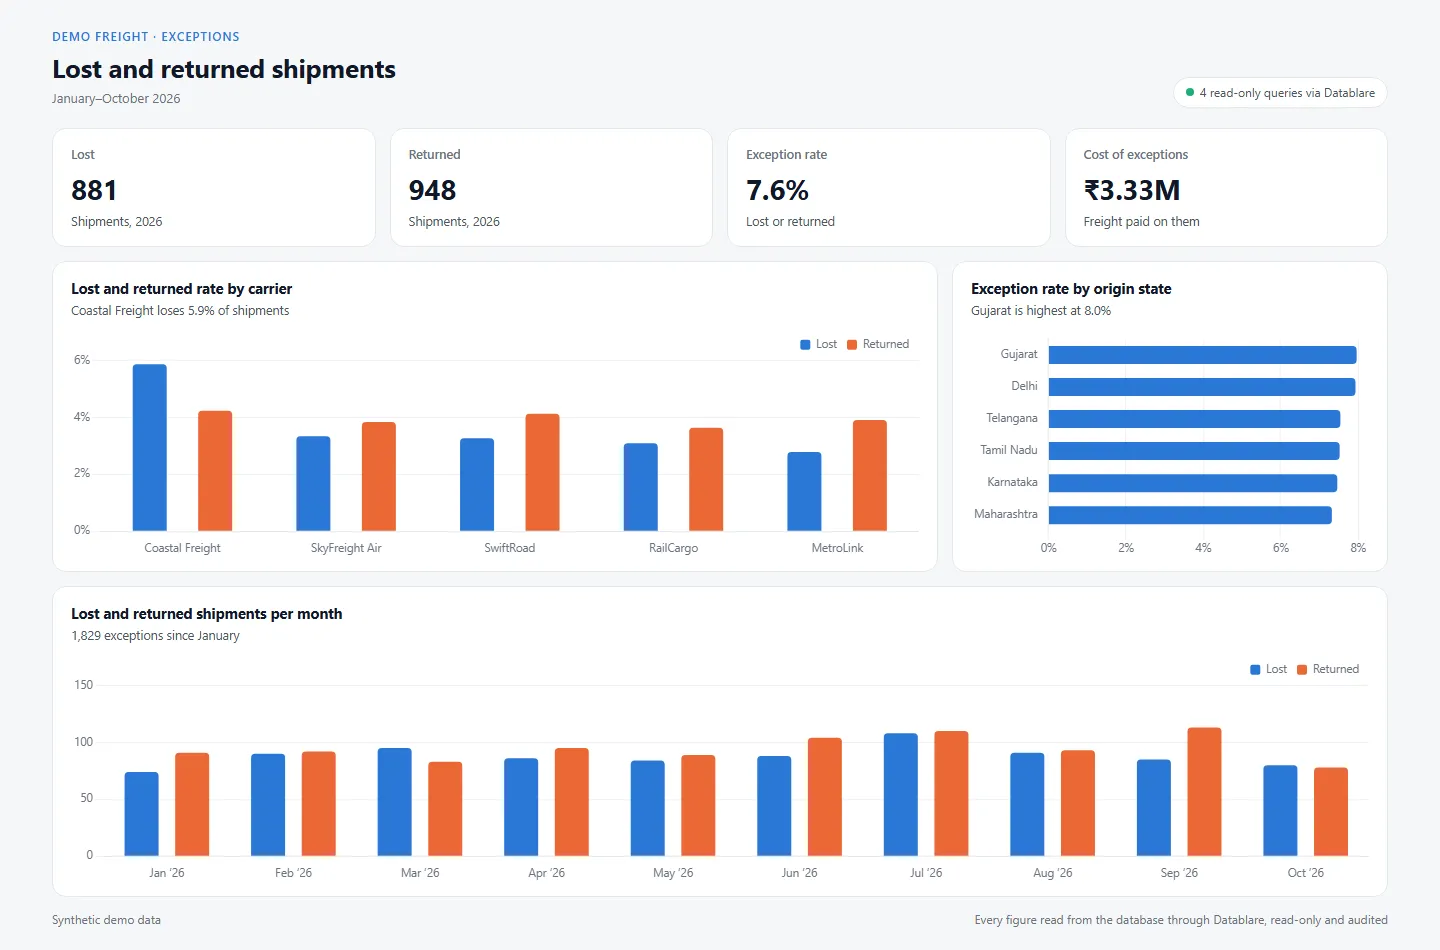
  • Lost and returned shipments dashboard: Lost and returned rate by carrier, Exception rate by origin state, Lost and returned shipments per month
    Claude Code Logistics Risk & compliance

    Lost and returned shipments

    881 shipments lost and 948 returned this year, costing ₹3.33M; Coastal Freight loses about twice as many as other carriers.

    Updated Open

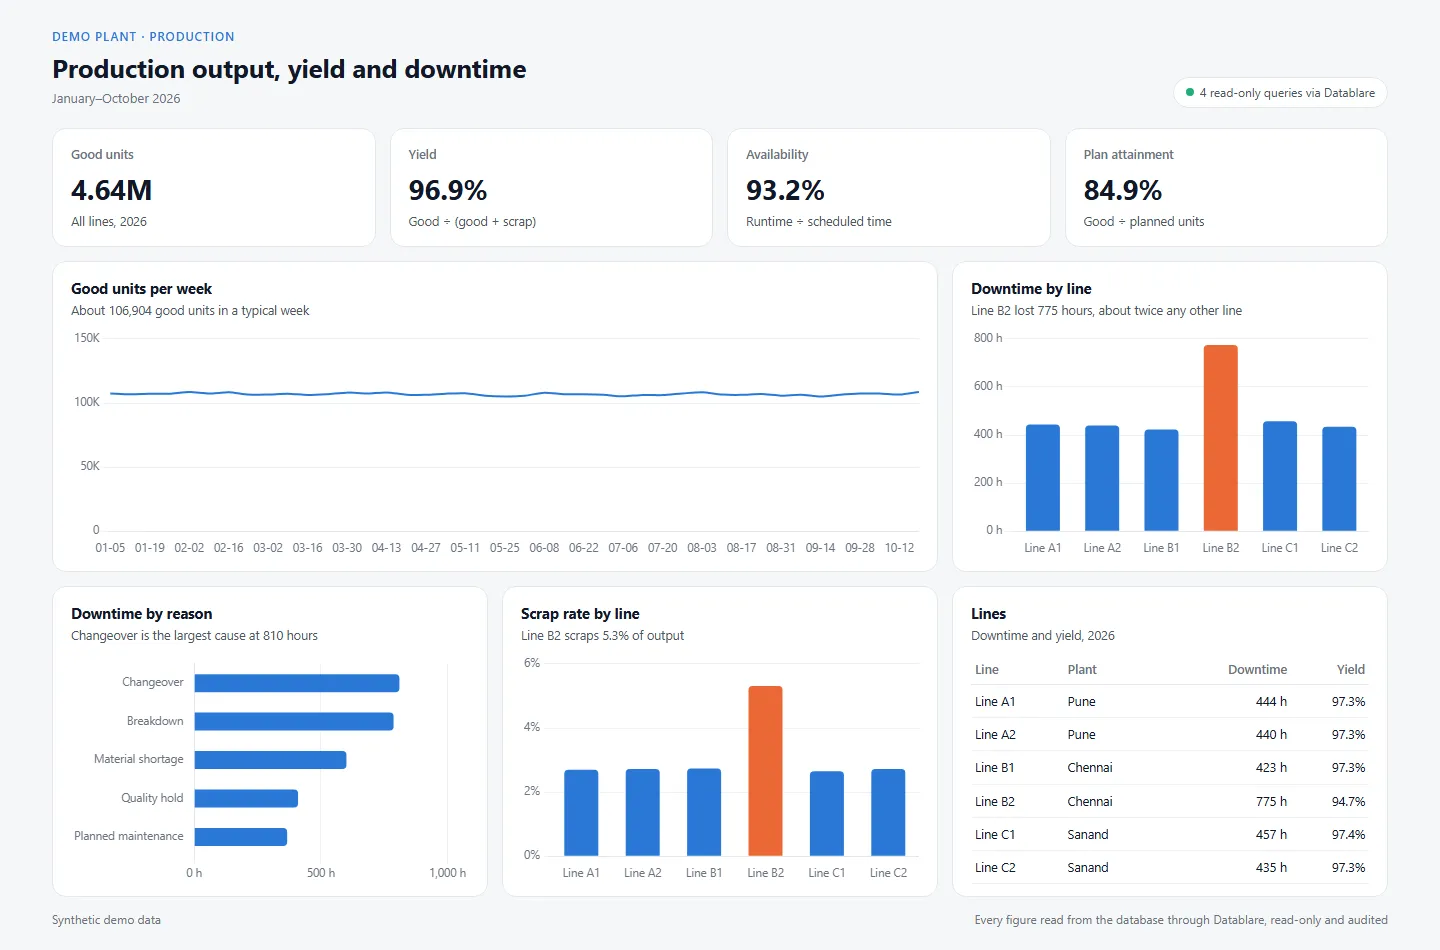
  • Production output, yield and downtime dashboard: Good units per week, Downtime by line, Downtime by reason, Scrap rate by line, Lines
    Claude Code Manufacturing Operations

    Production output, yield and downtime

    4.64M good units at 96.9% yield and 84.9% plan attainment, with downtime by line and reason pointing at Line B2.

    Updated Open

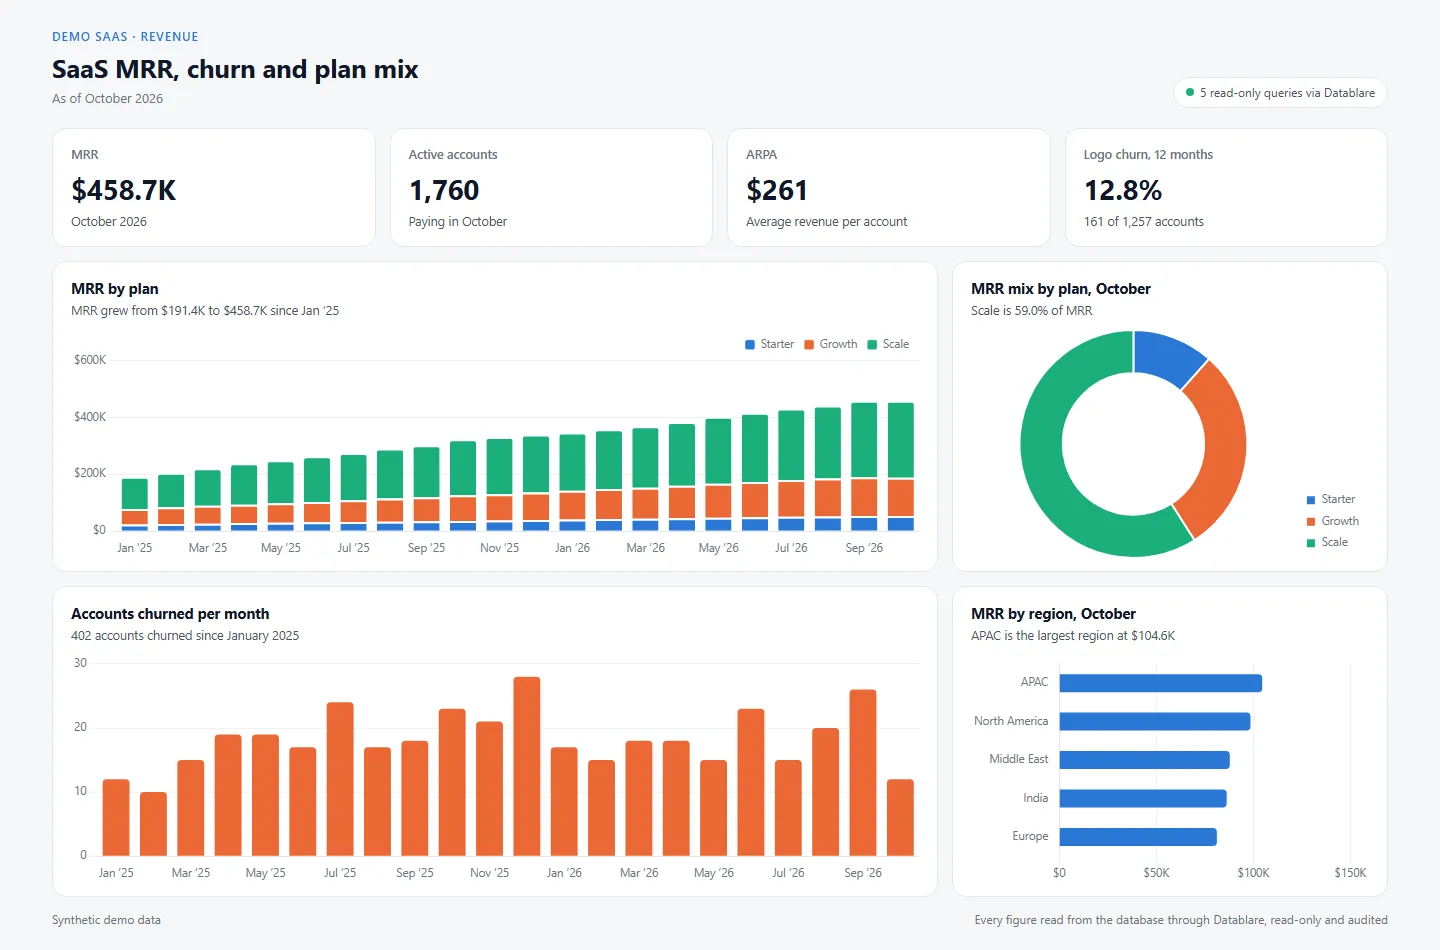
  • SaaS MRR, churn and plan mix dashboard: MRR by plan, MRR mix by plan, October, Accounts churned per month, MRR by region, October
    Claude Code SaaS Revenue & growth

    SaaS MRR, churn and plan mix

    $458.7K MRR across 1,760 accounts, 12.8% logo churn over 12 months, MRR by plan and region, and churn month by month.

    Updated Open

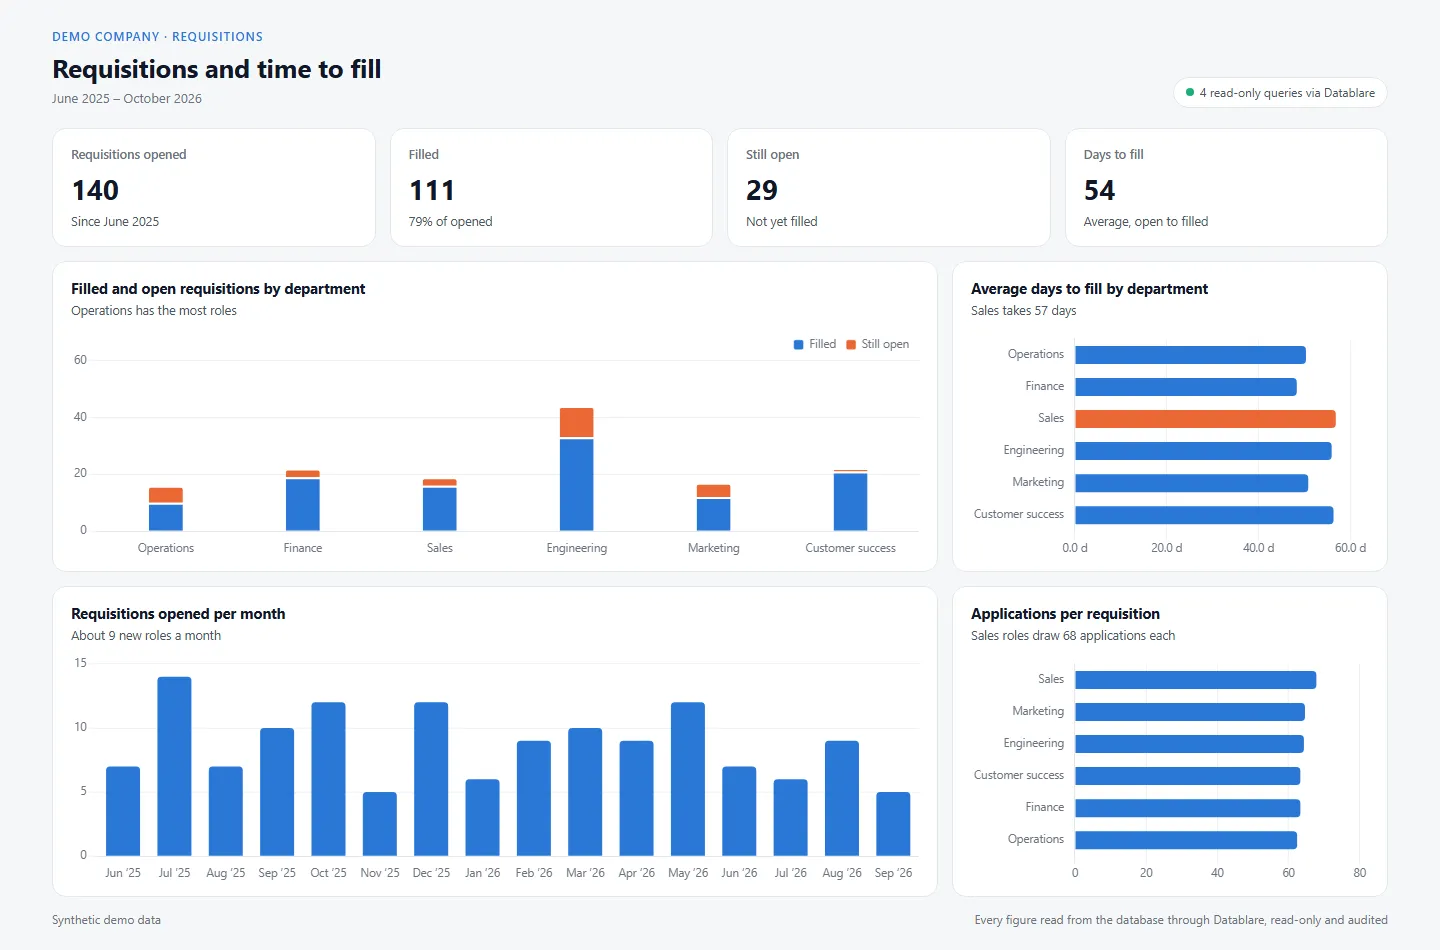
  • Requisitions and time to fill dashboard: Filled and open requisitions by department, Average days to fill by department, Requisitions opened per month, Applications per requisition
    Claude Code Human resources People & hiring

    Requisitions and time to fill

    140 requisitions opened, 111 filled in 54 days on average, 29 still open; Sales takes longest.

    Updated Open

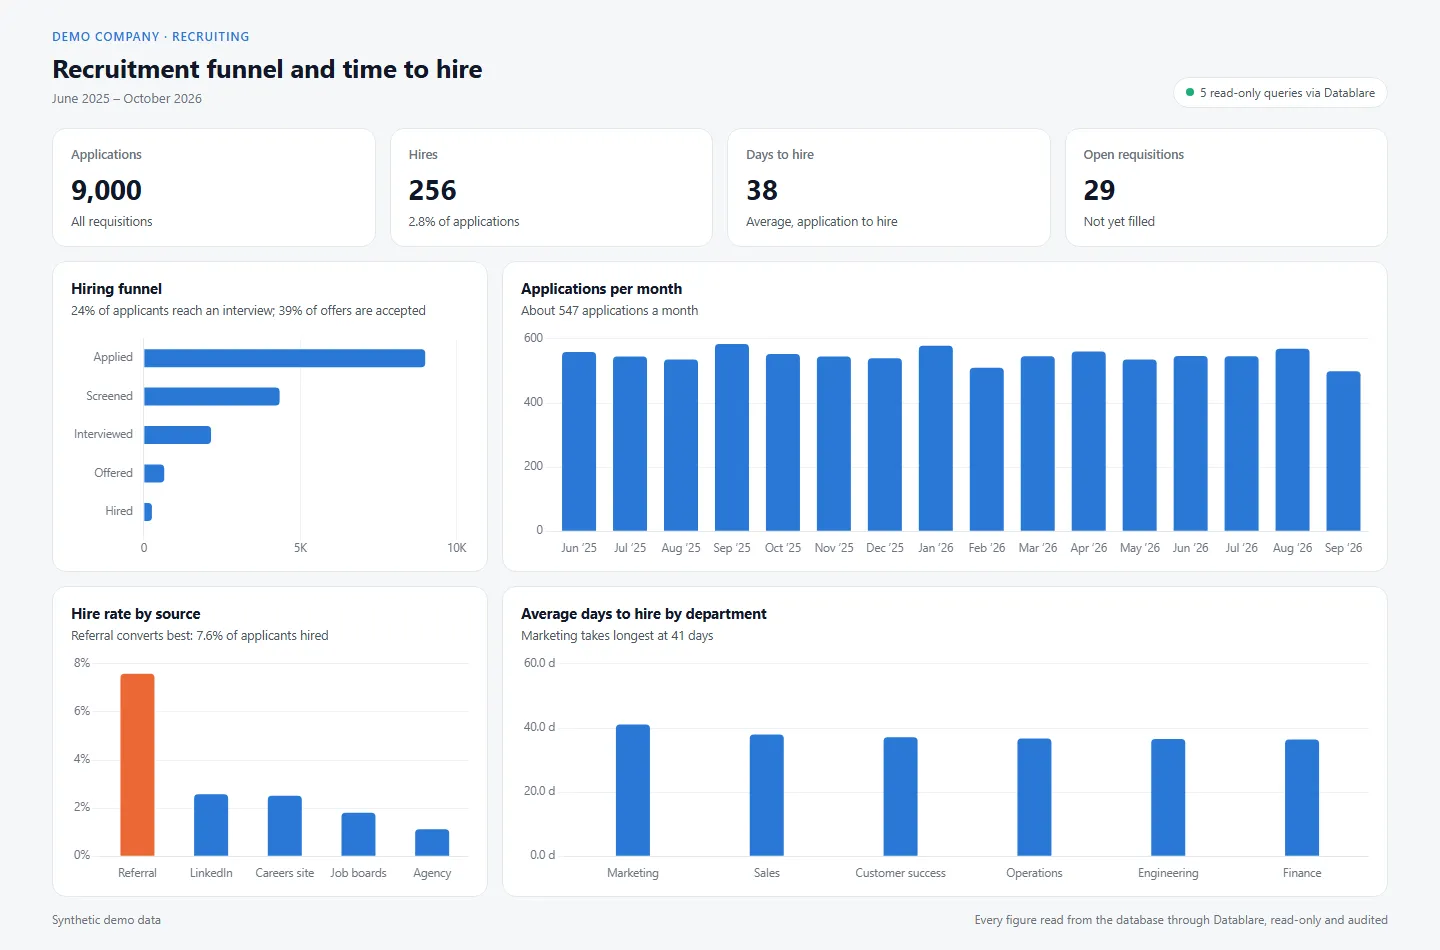
  • Recruitment funnel and time to hire dashboard: Hiring funnel, Applications per month, Hire rate by source, Average days to hire by department
    Claude Code Human resources People & hiring

    Recruitment funnel and time to hire

    9,000 applications and 256 hires, 38 days to hire on average, the funnel stage by stage and which sources convert.

    Updated Open

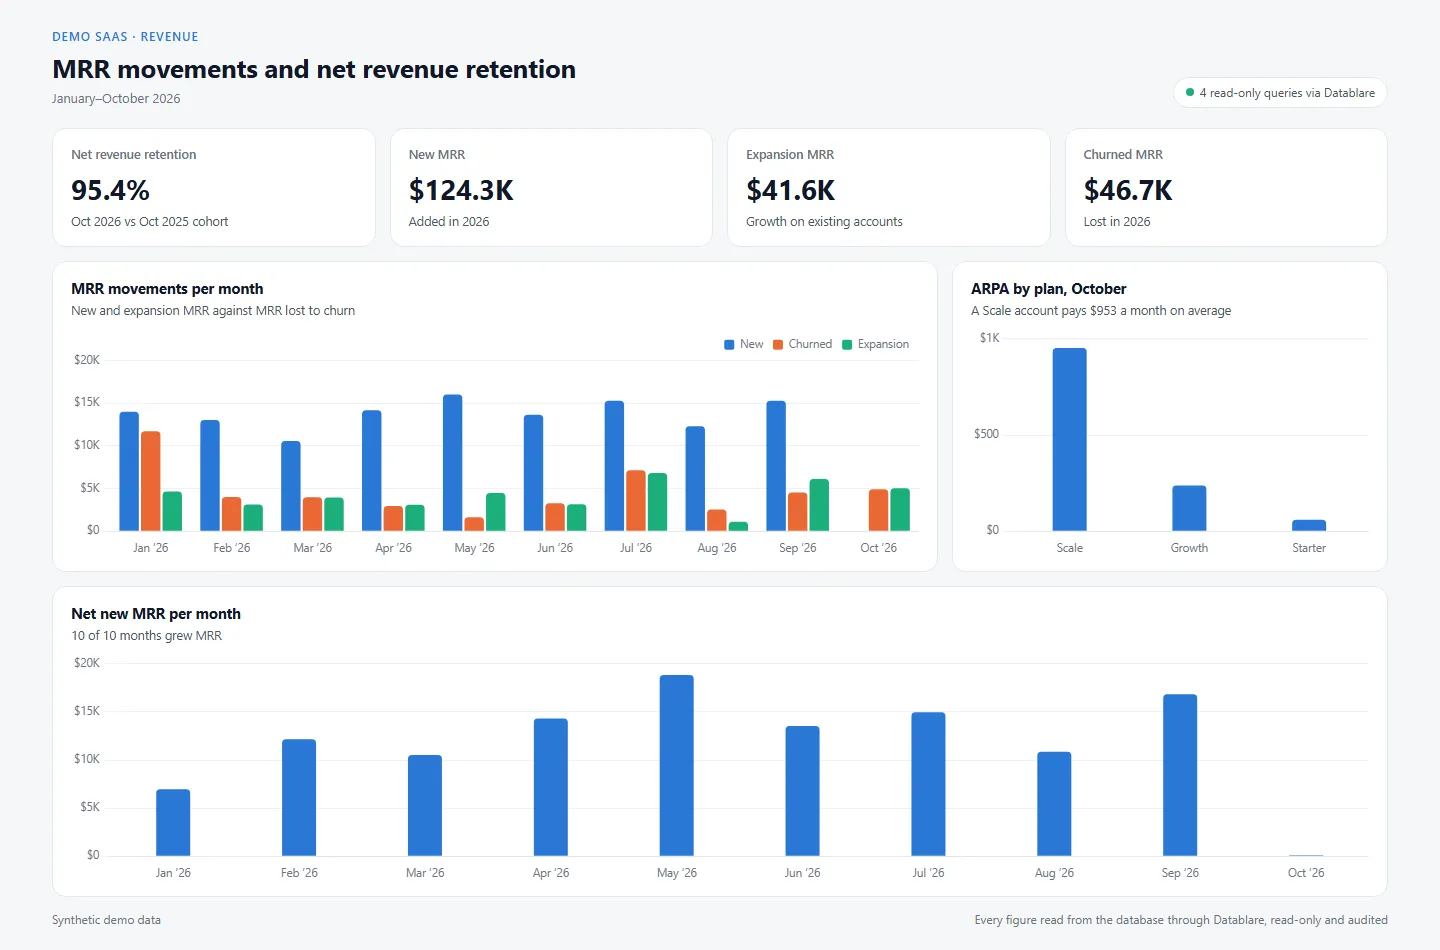
  • MRR movements and net revenue retention dashboard: MRR movements per month, ARPA by plan, October, Net new MRR per month
    Claude Code SaaS Revenue & growth

    MRR movements and net revenue retention

    Net revenue retention of 95.4%, $124.3K of new MRR this year and $46.7K lost to churn, with ARPA by plan.

    Updated Open

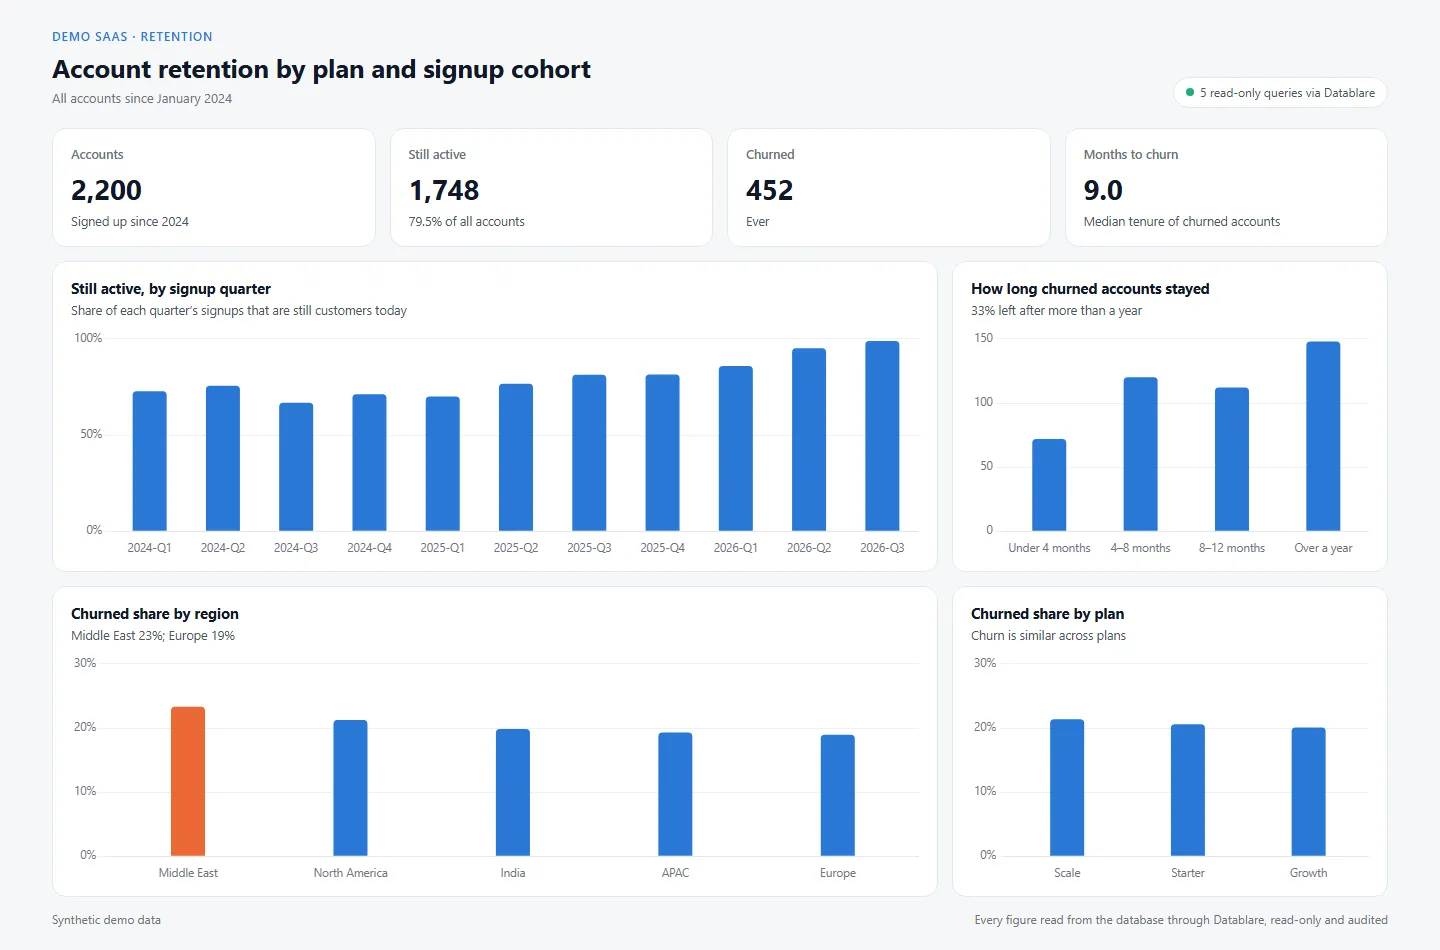
  • Account retention by plan and signup cohort dashboard: Still active, by signup quarter, How long churned accounts stayed, Churned share by region, Churned share by plan
    Claude Code SaaS Customer analytics

    Account retention by plan and signup cohort

    452 of 2,200 accounts have churned, after a median 9.0 months; Middle East churns most.

    Updated Open

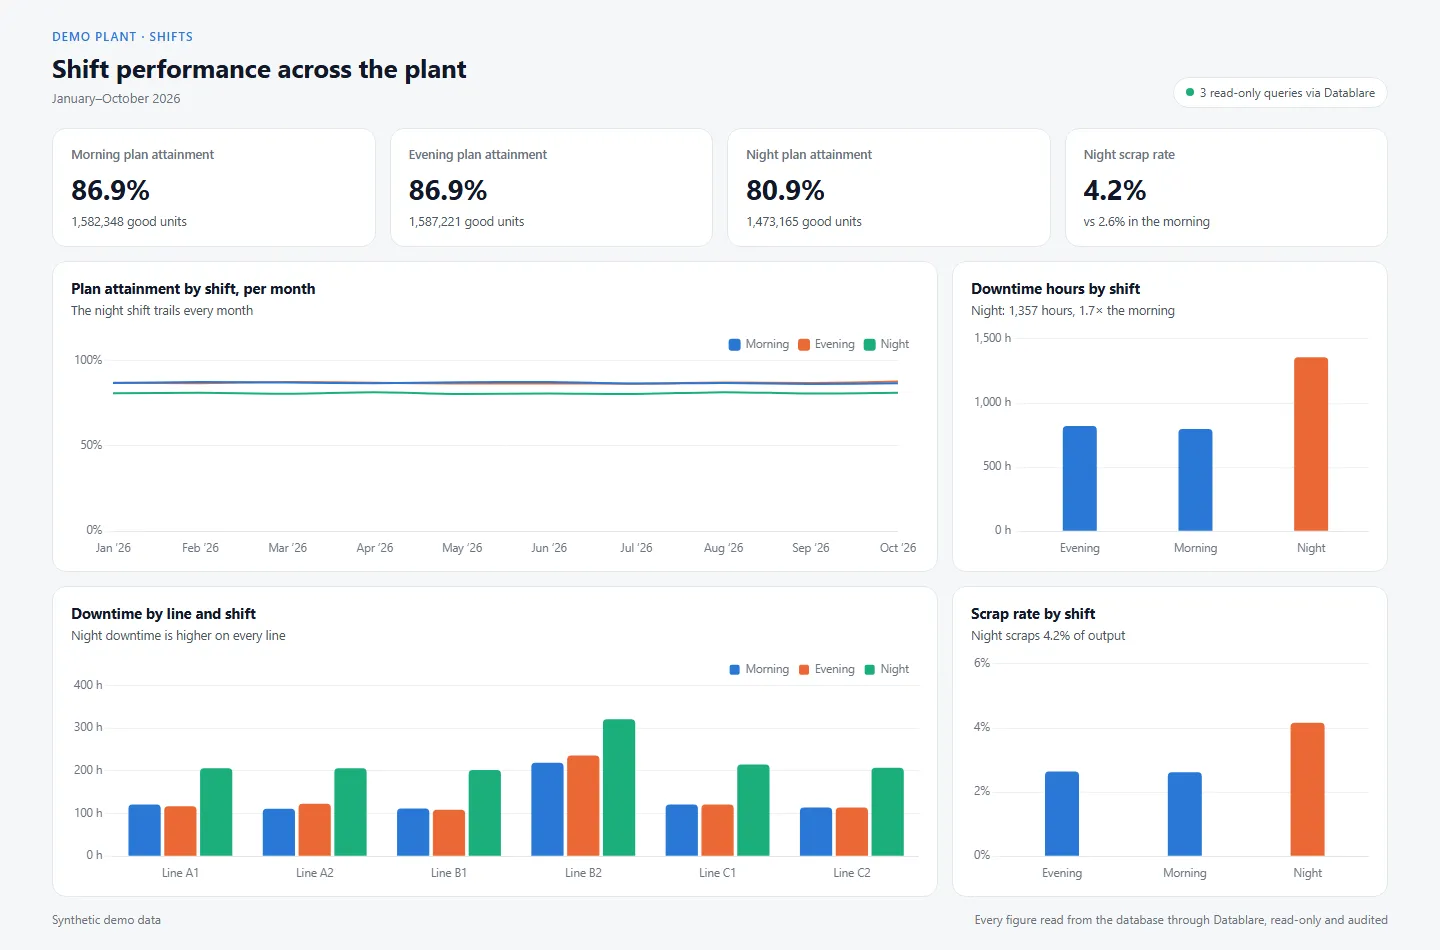
  • Shift performance across the plant dashboard: Plan attainment by shift, per month, Downtime hours by shift, Downtime by line and shift, Scrap rate by shift
    Claude Code Manufacturing Operations

    Shift performance across the plant

    The night shift reaches 80.9% of plan against 86.9% in the morning, scraps 4.2% and loses 1,357 hours.

    Updated Open

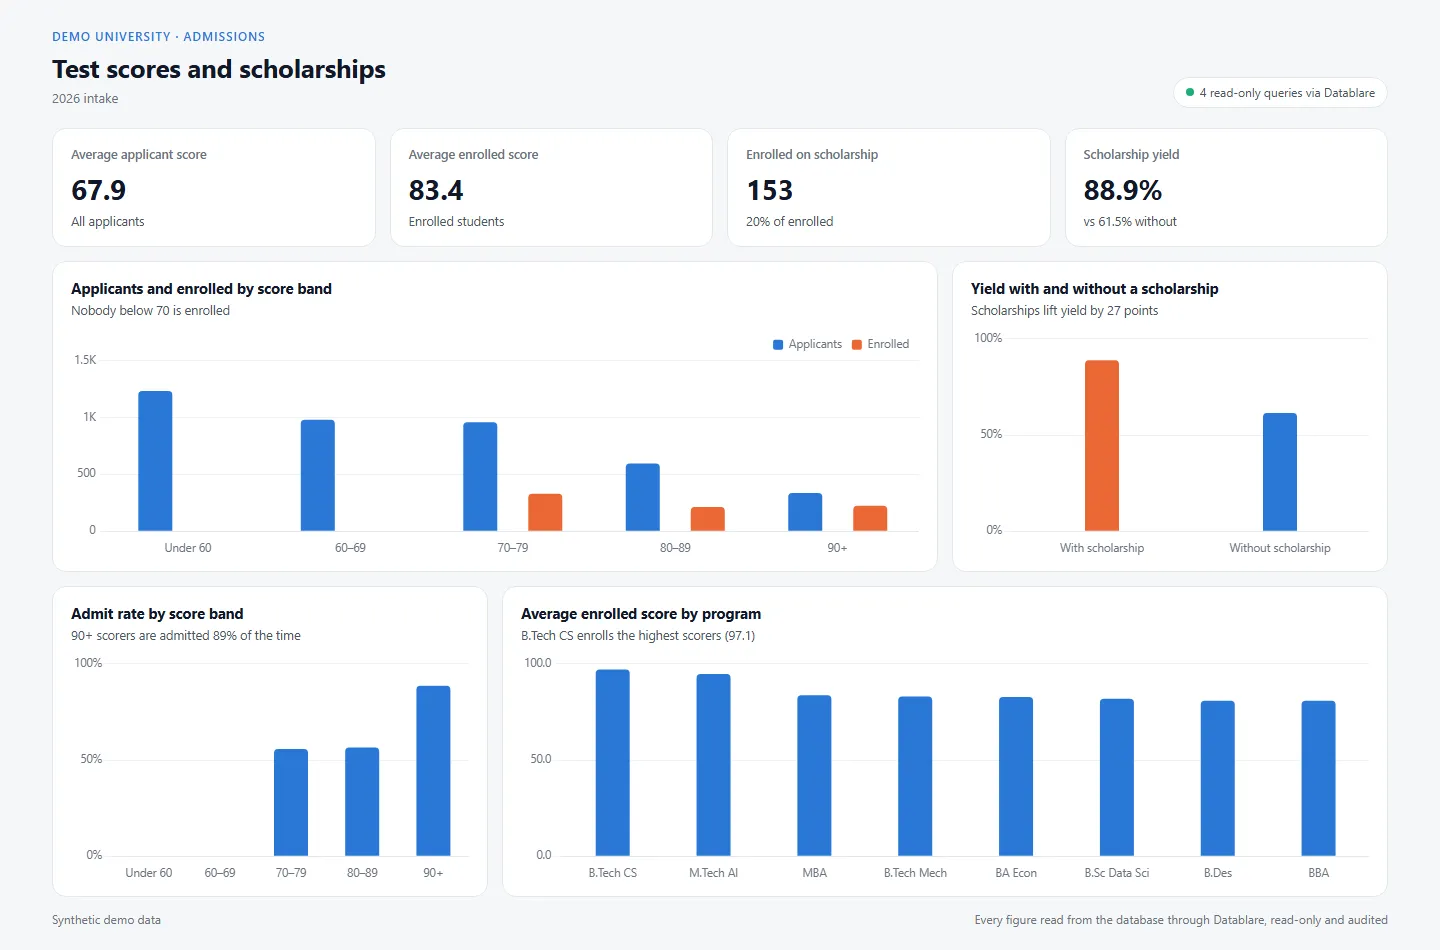
  • Test scores and scholarships dashboard: Applicants and enrolled by score band, Yield with and without a scholarship, Admit rate by score band, Average enrolled score by program
    Claude Code Education Admissions & enrollment

    Test scores and scholarships

    Enrolled students average 83.4 against 67.9 for all applicants, and scholarships lift yield from 62% to 89%.

    Updated Open

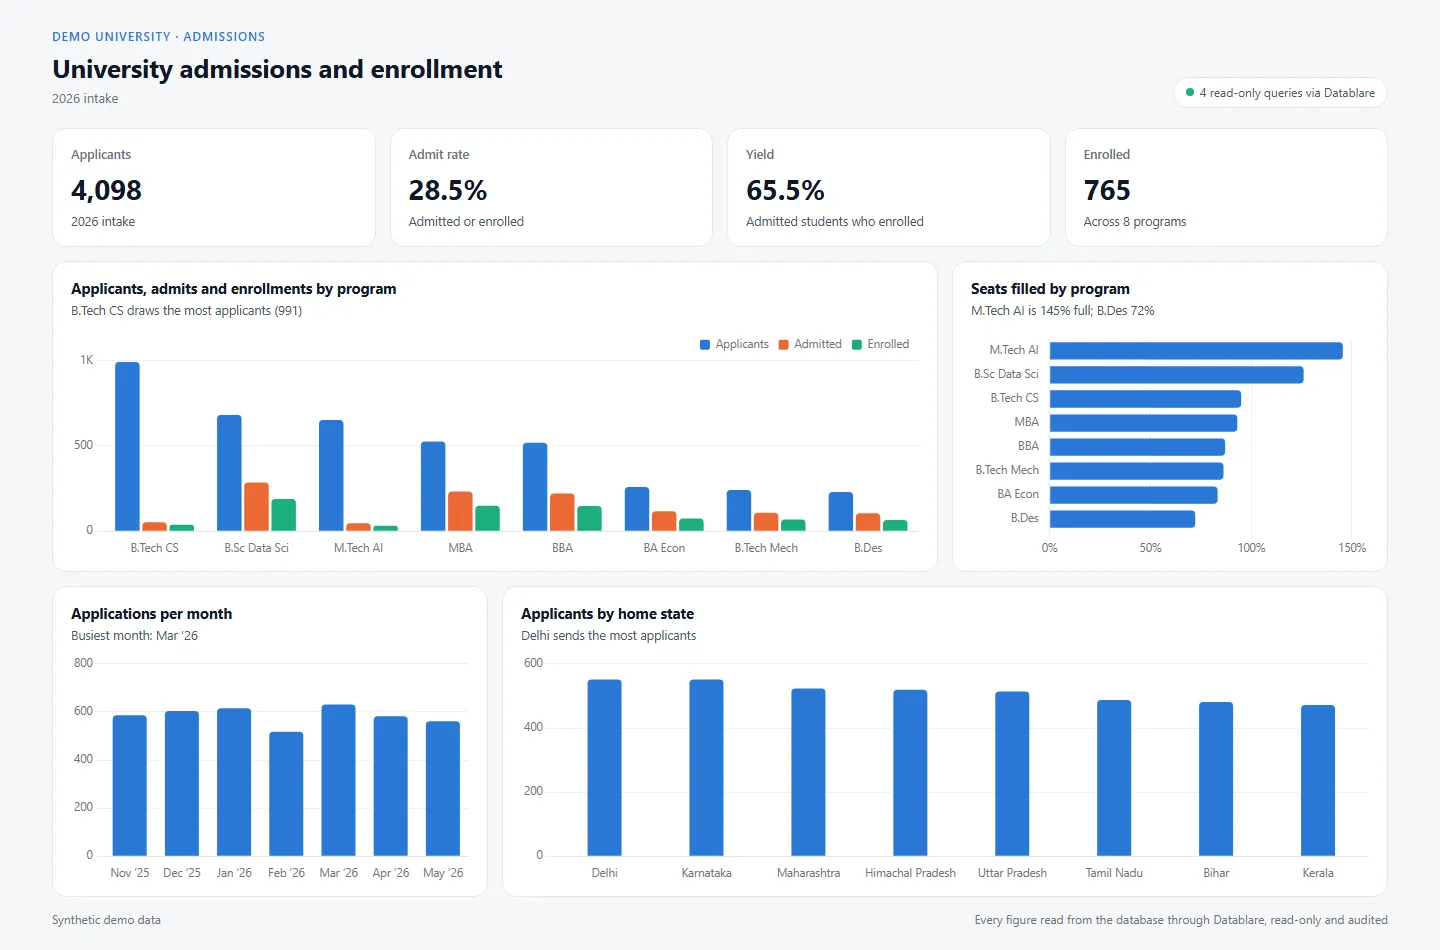
  • University admissions and enrollment dashboard: Applicants, admits and enrollments by program, Seats filled by program, Applications per month, Applicants by home state
    Claude Code Education Admissions & enrollment

    University admissions and enrollment

    4,098 applicants for the 2026 intake, a 28.5% admit rate and 65.5% yield, by program against seats.

    Updated Open

Build these on your own data.

Connect your database, choose the tables Claude may read, and ask for the dashboard you need. Claude is connected in about two minutes.

30 minutes with the founder. Or WhatsApp / [email protected]