Skip to content
Datablare
Claude Code SaaS Customer analytics

Account retention by plan and signup cohort

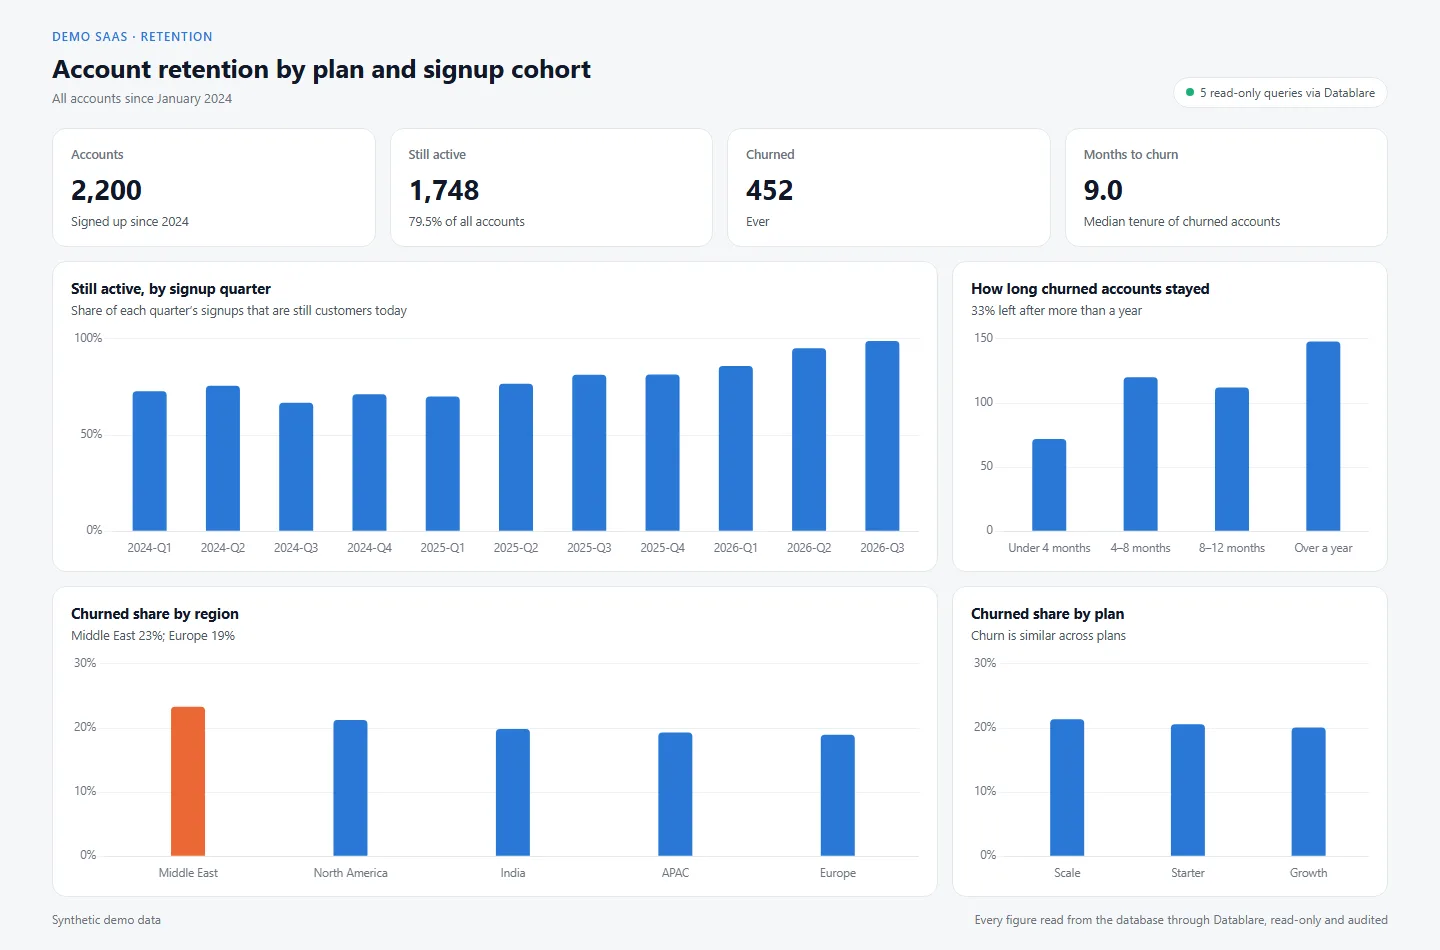
452 of 2,200 accounts have churned, after a median 9.0 months; Middle East churns most.

Data
Synthetic SaaS demo data (PostgreSQL)
Asked in
Claude Code
Updated
Try this on your data

1 · The brief

What Claude Code was asked

Where are we losing customers? Show churn by plan and region, how long accounts stay before they churn, and what share of each signup quarter is still with us today.

Given exactly like this. Claude Code asked Datablare which tables it could read, wrote the SQL itself, ran each query through Datablare and built the dashboard from what came back.

2 · The dashboard

The dashboard Claude Code built

Account retention by plan and signup cohort dashboard: Still active, by signup quarter, How long churned accounts stayed, Churned share by region, Churned share by plan

Built from 5 read-only queries. Every figure on the dashboard was read from the database through Datablare; nothing was estimated or typed in.

Headline numbers (All accounts since January 2024):

  • Accounts: 2,200 (Signed up since 2024)
  • Still active: 1,748 (79.5% of all accounts)
  • Churned: 452 (Ever)
  • Months to churn: 9.0 (Median tenure of churned accounts)

What stands out:

  • Still active, by signup quarter: Share of each quarter’s signups that are still customers today
  • How long churned accounts stayed: 33% left after more than a year
  • Churned share by region: Middle East 23%; Europe 19%
  • Churned share by plan: Churn is similar across plans

The data is a synthetic SaaS dataset made for this example, so the numbers describe no real company. The queries, the dashboard and the audit entries are real: Claude reached the database only through Datablare, read-only, and every query is on record with the question it served.
3 · What Datablare ran

5 read-only queries, nothing changed

Each query below is copied from the audit log of this run. Datablare checked that it only reads, ran it read-only, and gave only the rows to Claude Code; it never stores them.

  1. Query 1

    Accounts ever signed, churned, still active, and median tenure at churn in months

    1 row · 39 ms

    SELECT count(*) AS accounts, count(churn_date) AS churned, count(*) - count(churn_date) AS active,
           round((percentile_cont(0.5) WITHIN GROUP (ORDER BY churn_date - signup_date) / 30.4)::numeric, 1) AS median_months_to_churn
    FROM saas.accounts
  2. Query 2

    Share of accounts on each plan that have churned

    3 rows · 53 ms

    SELECT plan, count(*) AS accounts, count(churn_date) AS churned, round(count(churn_date)::numeric / count(*), 4) AS churned_share
    FROM saas.accounts
    GROUP BY 1
    ORDER BY 4 DESC
  3. Query 3

    How long churned accounts stayed, in tenure bands

    4 rows · 42 ms

    SELECT CASE WHEN churn_date - signup_date < 120 THEN '1. Under 4 months'
                WHEN churn_date - signup_date < 240 THEN '2. 4–8 months'
                WHEN churn_date - signup_date < 365 THEN '3. 8–12 months'
                ELSE '4. Over a year' END AS tenure_band,
           count(*) AS churned_accounts
    FROM saas.accounts
    WHERE churn_date IS NOT NULL
    GROUP BY 1
    ORDER BY 1
  4. Query 4

    Share of each signup quarter still active today

    11 rows · 44 ms

    SELECT to_char(date_trunc('quarter', signup_date), 'YYYY-"Q"Q') AS cohort, count(*) AS signed_up,
           round(avg(CASE WHEN churn_date IS NULL THEN 1.0 ELSE 0 END), 4) AS still_active
    FROM saas.accounts
    GROUP BY 1
    ORDER BY 1
  5. Query 5

    Share of accounts in each region that have churned

    5 rows · 45 ms

    SELECT region, count(*) AS accounts, round(count(churn_date)::numeric / count(*), 4) AS churned_share
    FROM saas.accounts
    GROUP BY 1
    ORDER BY 3 DESC
Tables read saas.accounts

4 · The audit entry

Who asked what, on record

Every query is recorded with the person who asked, the question in their words and why the agent ran it. Admins see this in the audit log; nothing reaches the database without it.

How the audit log works

query_data_source

via Claude Code

Allowed
Who
The person signed in (hidden on this public page)
Question
Where are we losing customers? Show churn by plan and region, how long accounts stay before they churn, and what share of each signup quarter is still with us today.
Intent
Accounts ever signed, churned, still active, and median tenure at churn in months
Result
5 queries, 24 rows, read-only

More use cases

All examples
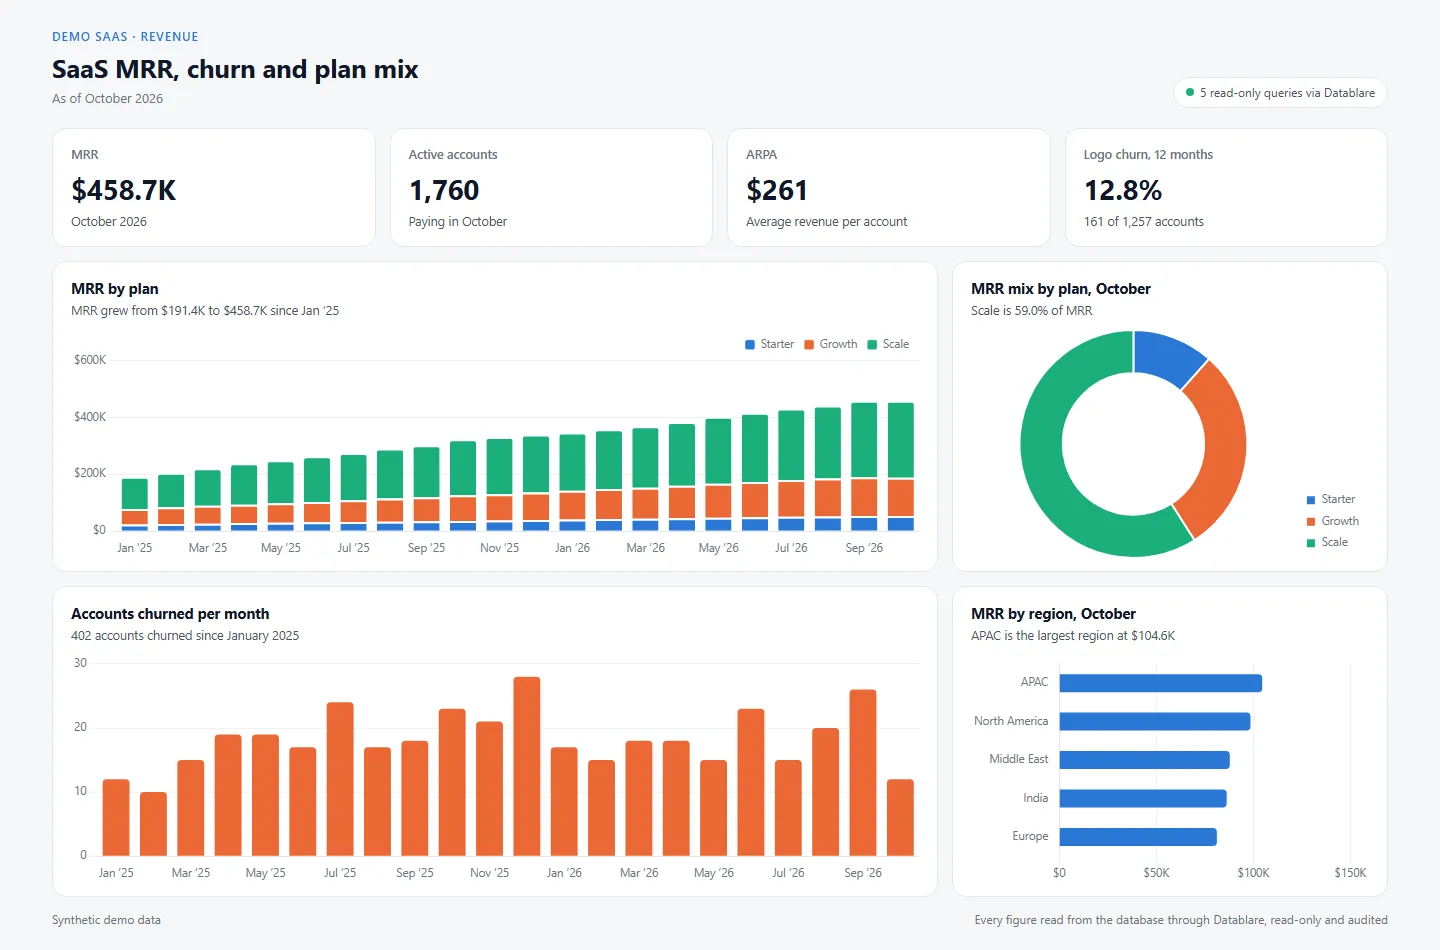
  • SaaS MRR, churn and plan mix dashboard: MRR by plan, MRR mix by plan, October, Accounts churned per month, MRR by region, October
    Claude Code SaaS Revenue & growth

    SaaS MRR, churn and plan mix

    $458.7K MRR across 1,760 accounts, 12.8% logo churn over 12 months, MRR by plan and region, and churn month by month.

    Updated Open

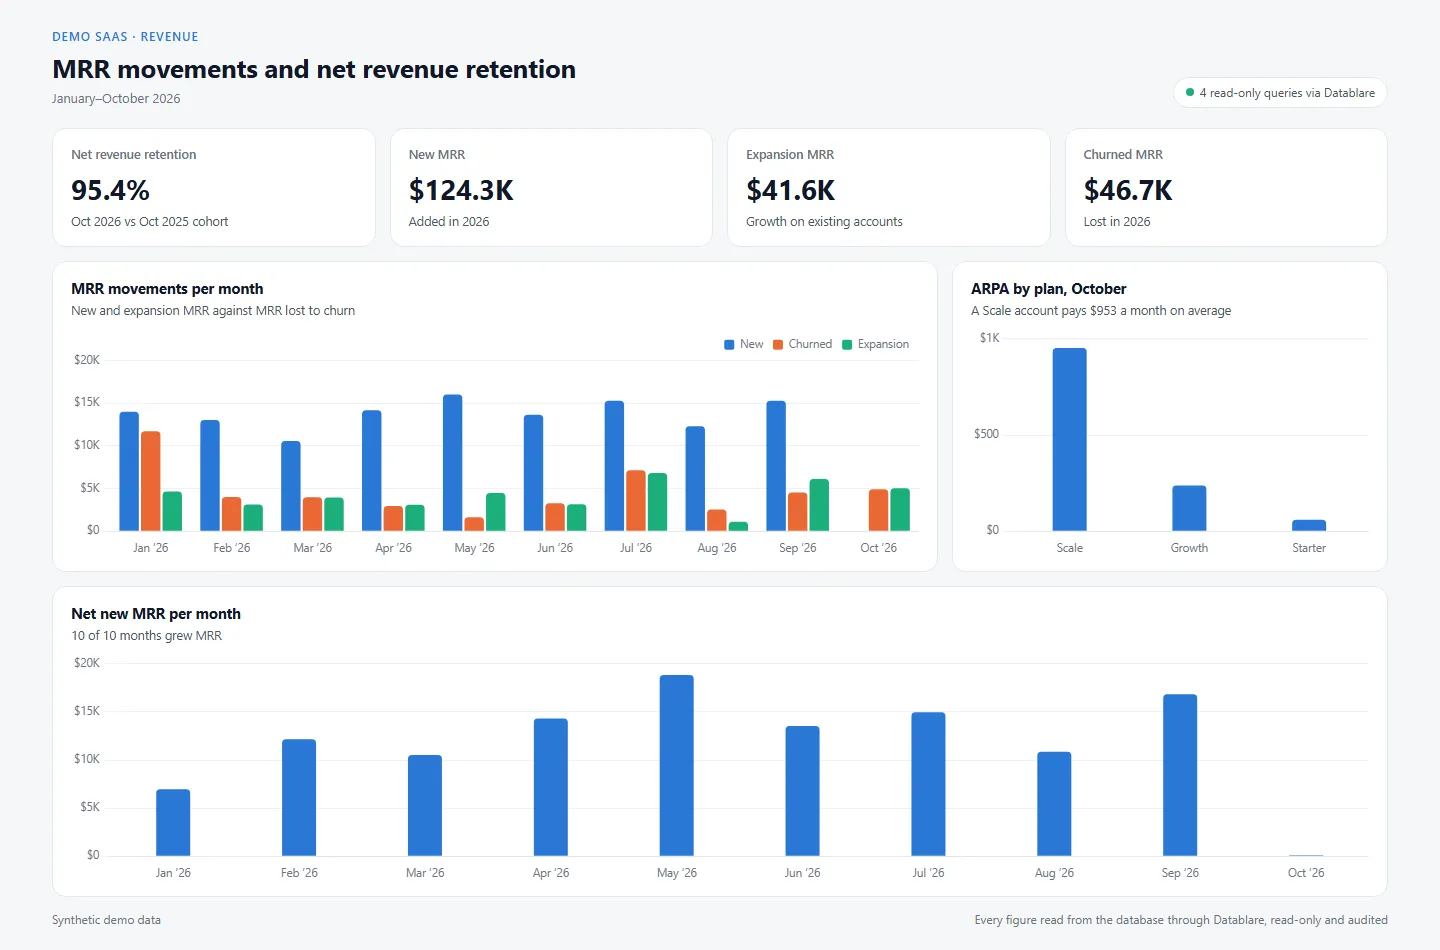
  • MRR movements and net revenue retention dashboard: MRR movements per month, ARPA by plan, October, Net new MRR per month
    Claude Code SaaS Revenue & growth

    MRR movements and net revenue retention

    Net revenue retention of 95.4%, $124.3K of new MRR this year and $46.7K lost to churn, with ARPA by plan.

    Updated Open

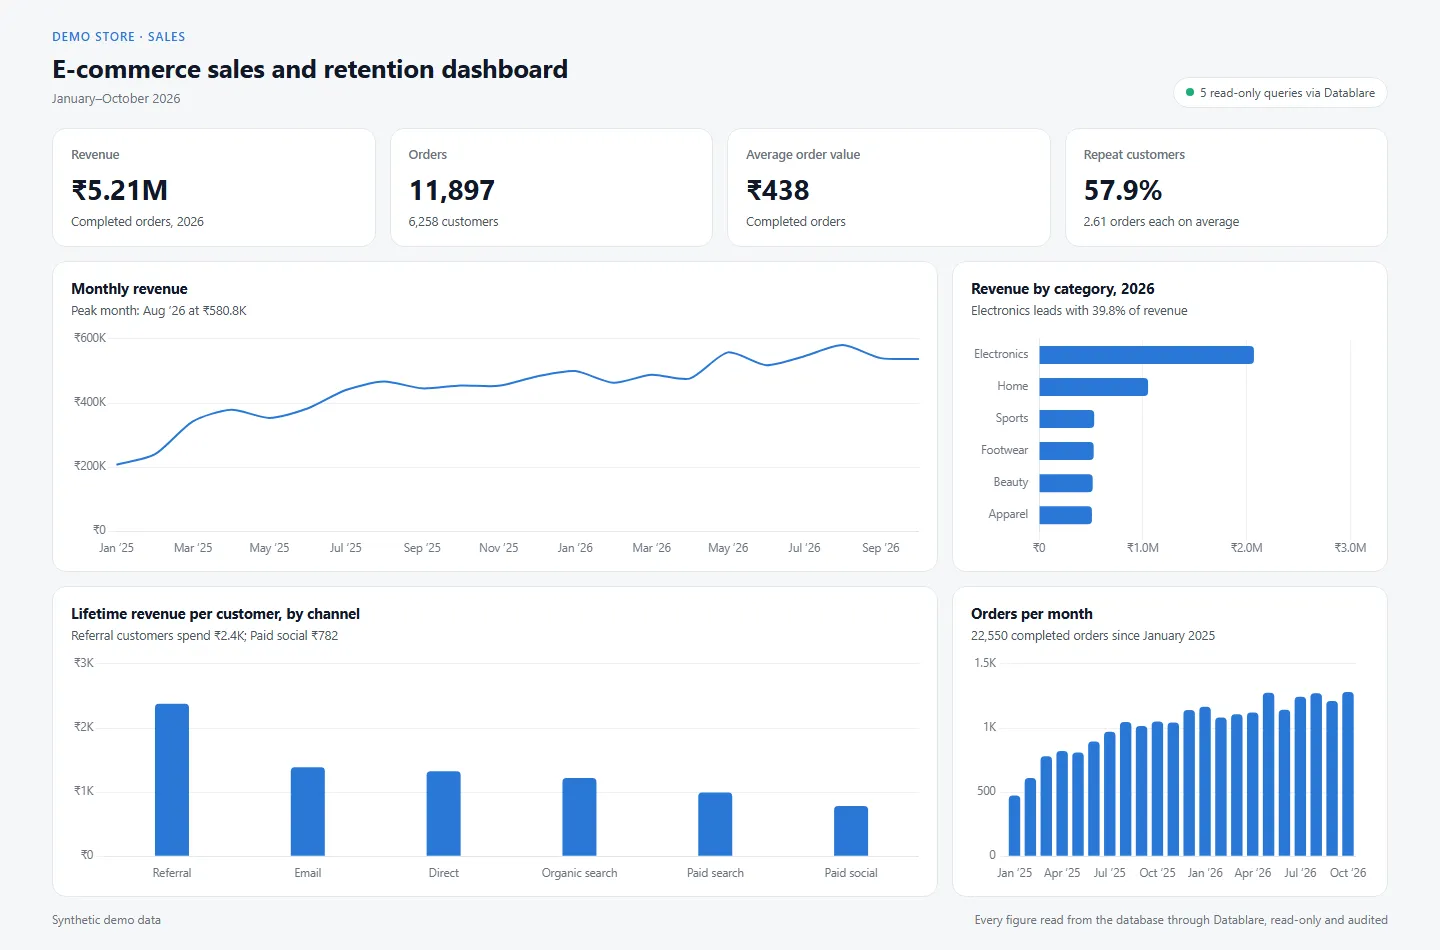
  • E-commerce sales and retention dashboard dashboard: Monthly revenue, Revenue by category, 2026, Lifetime revenue per customer, by channel, Orders per month
    Claude Code E-commerce Executive overview

    E-commerce sales and retention dashboard

    ₹5.21M revenue from 11,897 orders this year, a 57.9% repeat-customer rate, and which channels bring the customers who spend most.

    Updated Open

Build this on your own data.

Connect your database, choose the tables Claude may read, and give it the same brief. Claude is connected in about two minutes.

30 minutes with the founder. Or WhatsApp / [email protected]